Tag Archives: matplotlib

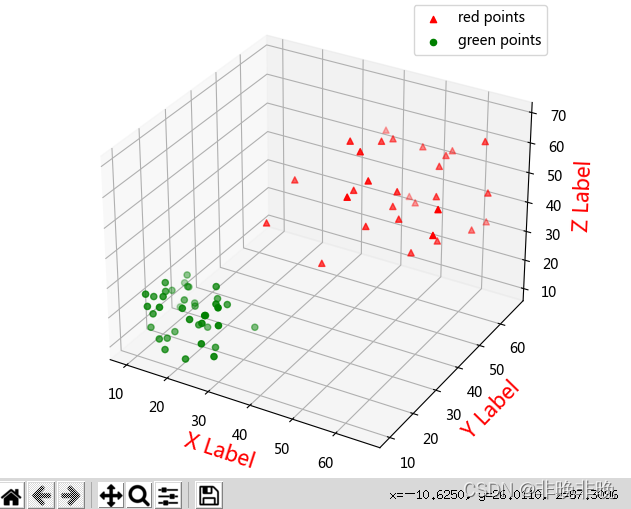
Matplotlib Draw 3D scatter Diagram Example

In the following code, it is shown that two different color scatter plots are drawn at the same time in the same coordinate system

import numpy as np
import matplotlib.pyplot as plt
from mpl_toolkits.mplot3d import Axes3D

#Generate random data
data1 = np.random.randint(30, 70, size=(30, 3)) #30*3 dimensional random integers of [30,70]
data2 = np.random.randint(10, 30, size=(40, 3)) #40*3 dimensions of [10, 30] random integers

x1 = data1[:, 0]
y1 = data1[:, 1]
z1 = data1[:, 2]

x2 = data2[:, 0]
y2 = data2[:, 1]
z2 = data2[:, 2]


# Plot a scatter plot
fig = plt.figure()
ax = Axes3D(fig)

'''
marker: shape, default round ball ('^' inverted triangle shape.)
c:color, default cyan

'''
ax.scatter(x1, y1, z1, c='r', marker = "^", label='red points')
ax.scatter(x2, y2, z2, c='g', label='green points')

# Plot the legend
ax.legend(loc='best')

# Add axes
ax.set_zlabel('Z Label', fontdict={'size': 15, 'color': 'red'}) 
ax.set_ylabel('Y Label', fontdict={'size': 15, 'color': 'red'})
ax.set_xlabel('X Label', fontdict={'size': 15, 'color': 'red'})
plt.show()

The results show that:

[Modified] Hive SQL Error: SQL ERROR [10004] [42000]: Error while compiling statement: FAILED: SemanticException [Error

SQL ERROR [10004] [42000]: Error while compiling statement: FAILED: SemanticException [Error 10004]: Line 64:0 Invalid table alias or column reference ‘T4’: (possible column names are: order_id, order_status, update_time, charge_id, charge_status, station_id, station_name, soc, totalpower, i_a, i_b, i_c, u_a, u_b, u_c, pri_opr_id)


Change to:

ORDER BY
a,
b

[Solved] Matplotlib scatter Draw Error: TypeError: ufunc ‘sqrt‘ not supported for the input types…rule ‘‘safe‘‘

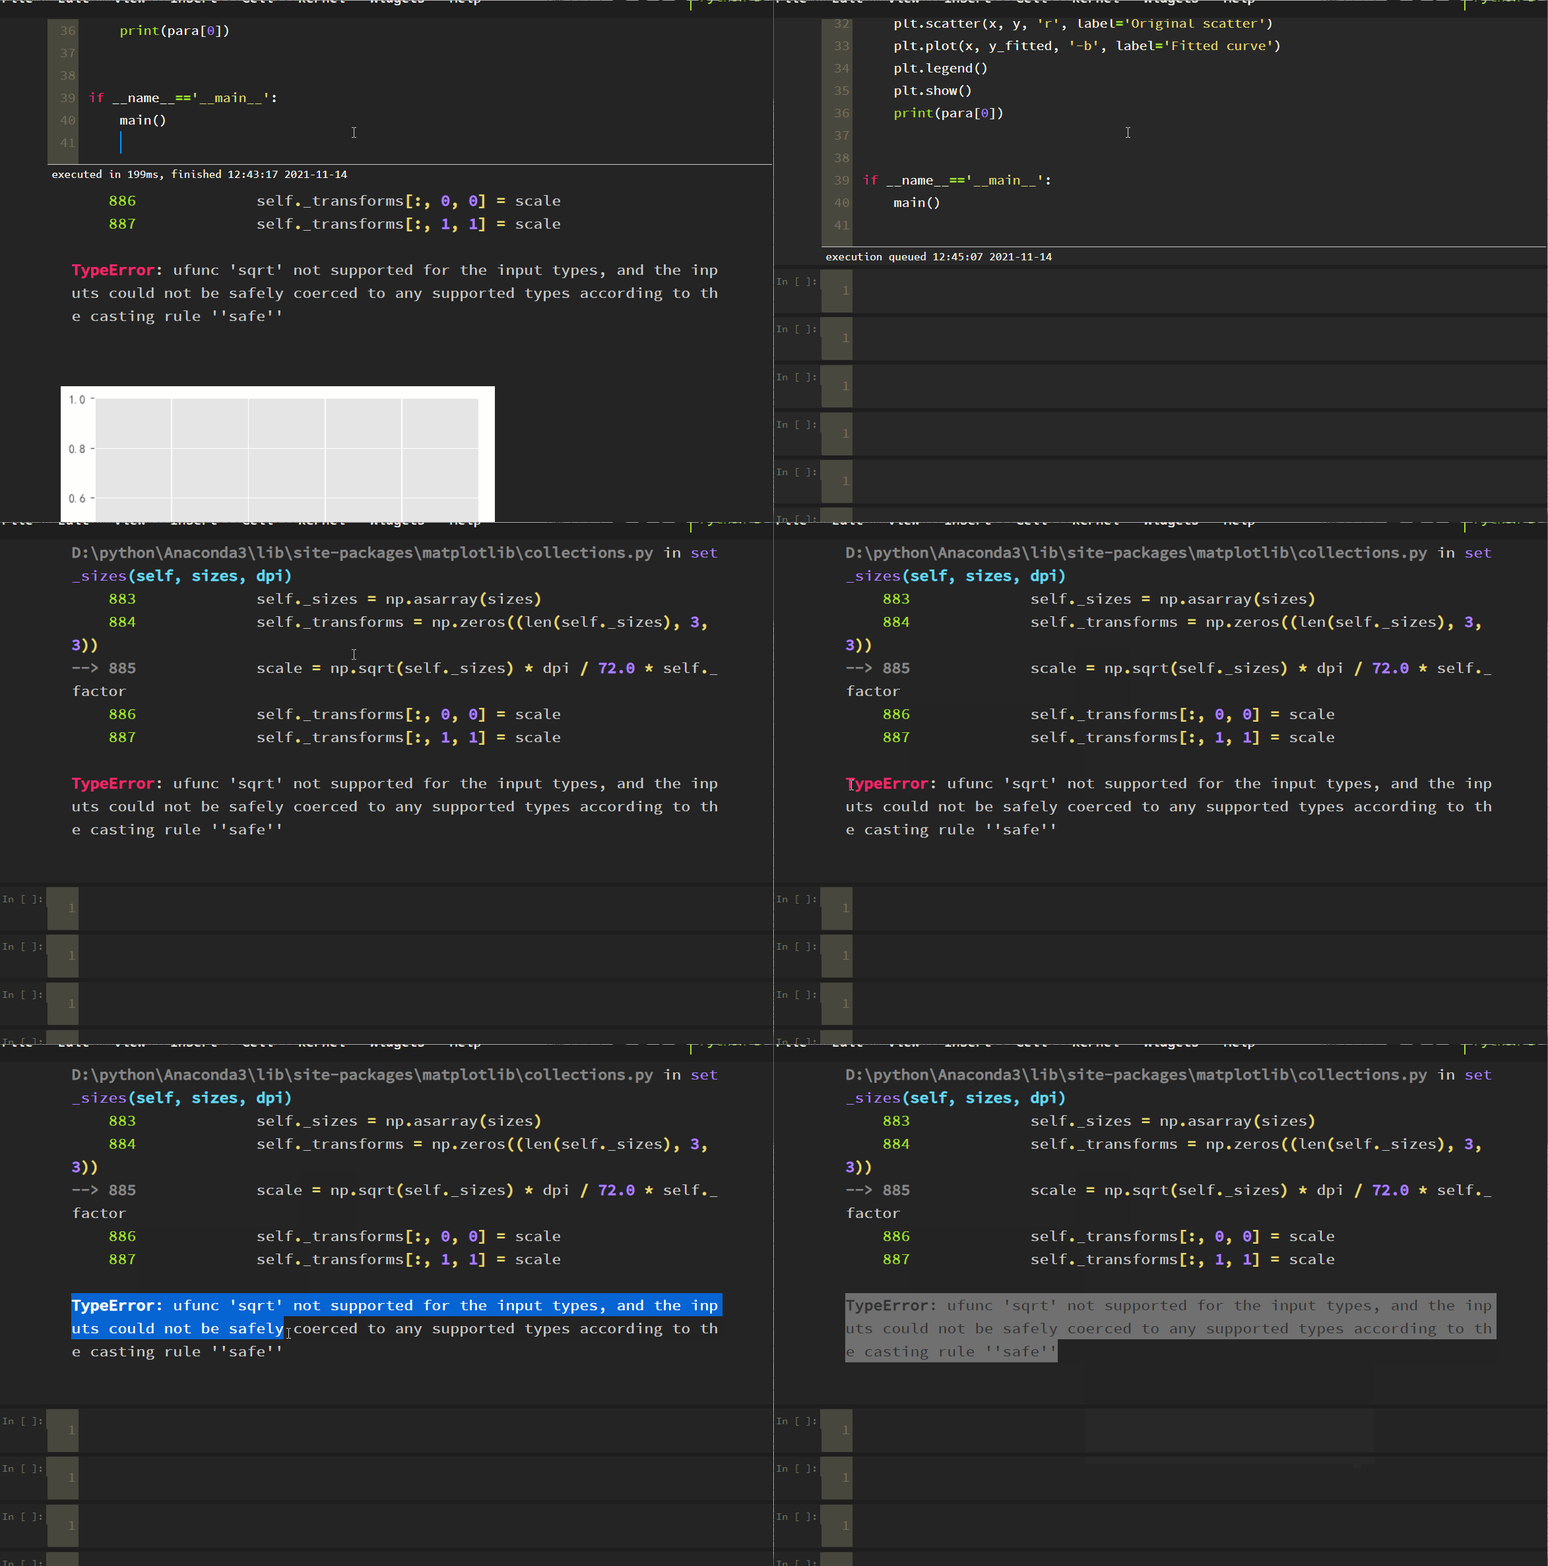
Errors are reported as follows:

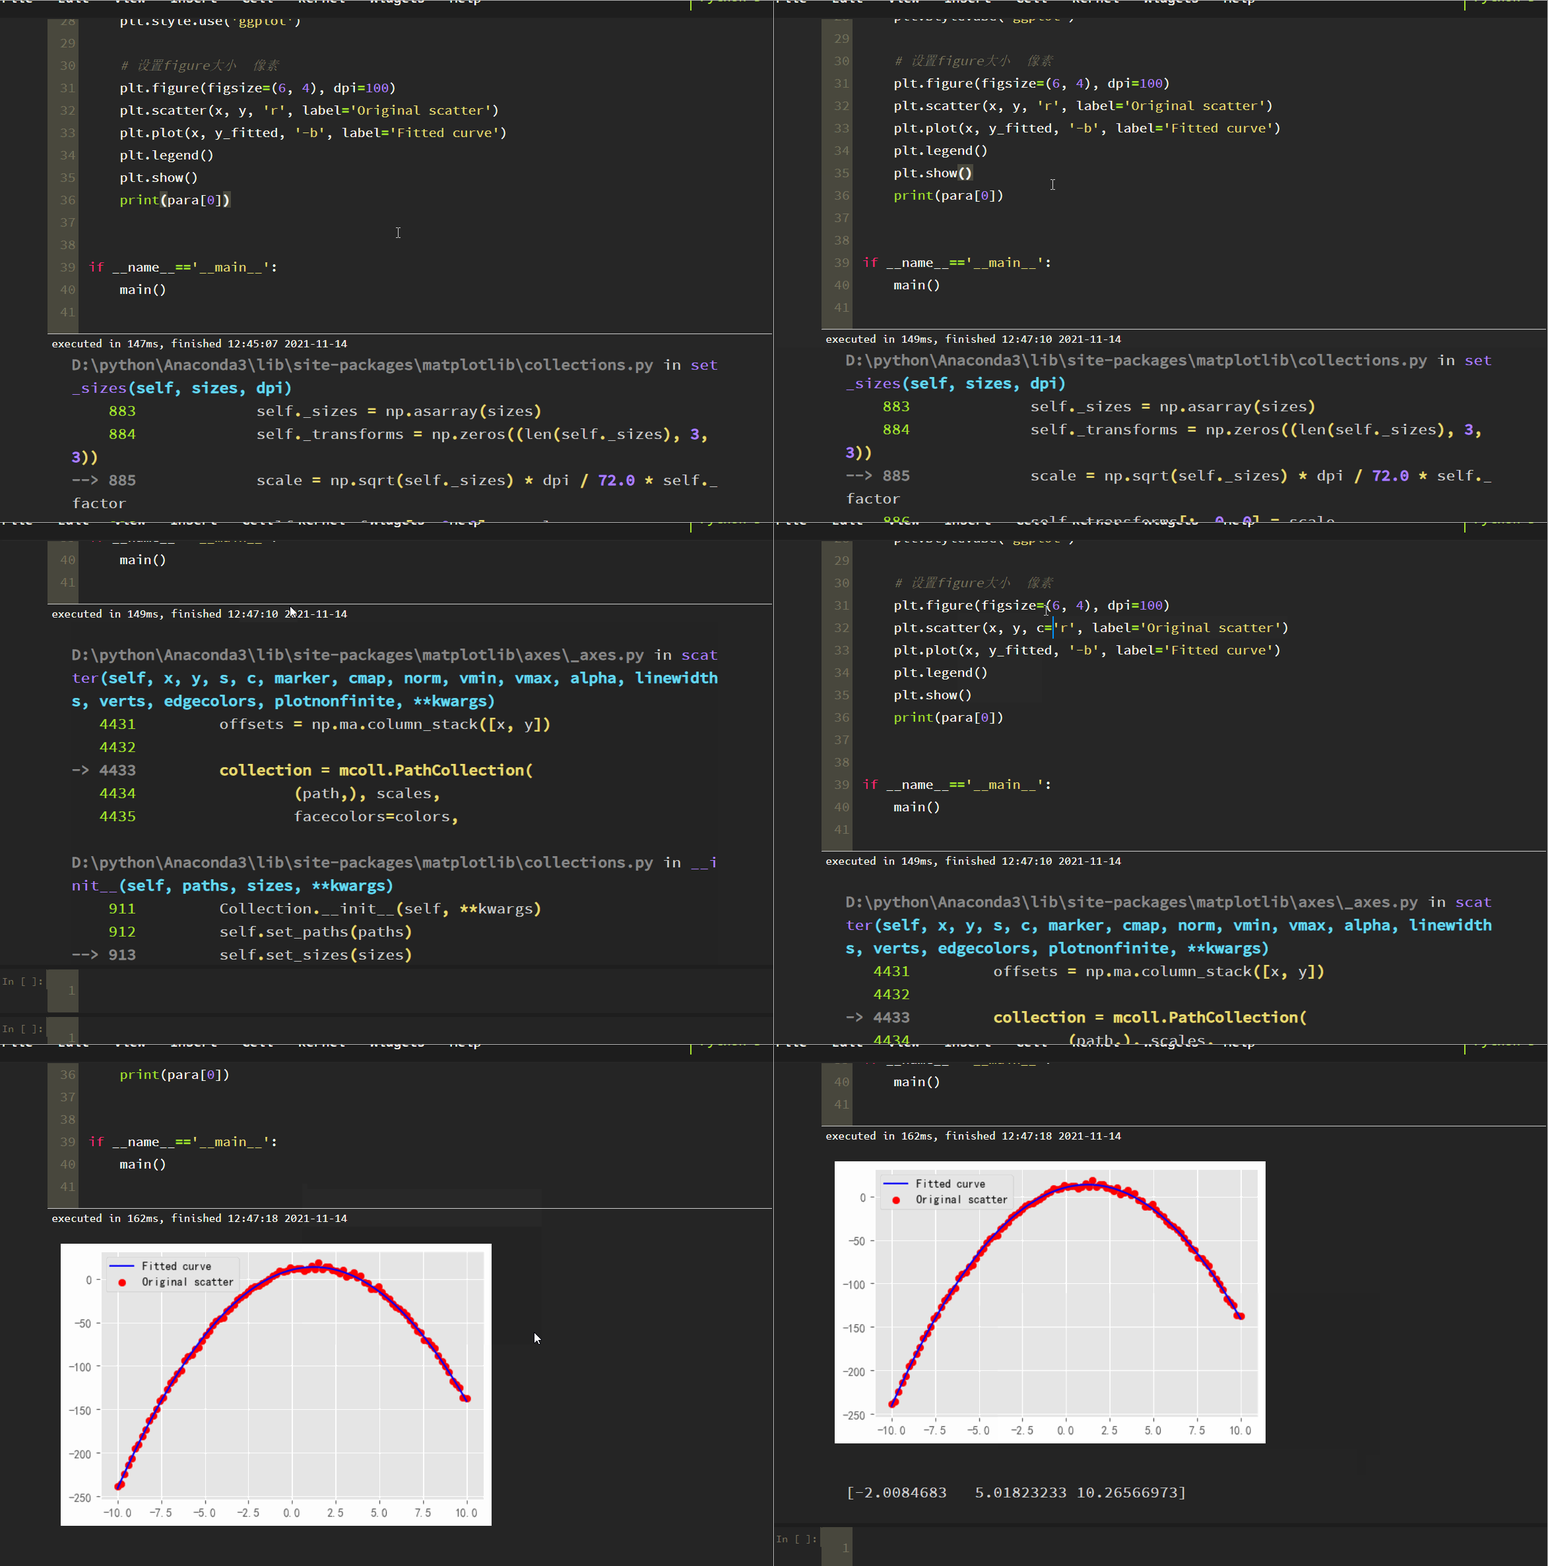
The solution is as follows:

Original program:
plt.scatter (x, y, ‘R’, label =’original scatter ‘)
modified as:
plt.scatter (x, y, C =’r’, label =’original scatter ‘)

The color setting parameter is set to: C = ‘R’

The problem was successfully resolved as follows:

[Solved] Python matplotlib Error: RuntimeError: In set_size: Could not set the fontsize…

Problem
Error when saving image:RuntimeError: In set_size: Could not set the fontsize

Traceback (most recent call last):
  File "/Users/robin/MLcode/Pycharm_Project/tensorflow/2021/0823_face_recognition_environment/0827_img_quality_analysis_v4.py", line 1556, in <module>
    image_cluster_analysis()
  File "/Users/robin/MLcode/Pycharm_Project/tensorflow/2021/0823_face_recognition_environment/0827_img_quality_analysis_v4.py", line 1549, in image_cluster_analysis
    image_showing(img_compressed)
  File "/Users/robin/MLcode/Pycharm_Project/tensorflow/2021/0823_face_recognition_environment/0827_img_quality_analysis_v4.py", line 1408, in image_showing
    plt.savefig(img_name)
  File "/Users/robin/software/anaconda3/envs/tensorflow/lib/python3.6/site-packages/matplotlib/pyplot.py", line 722, in savefig
    res = fig.savefig(*args, **kwargs)
  File "/Users/robin/software/anaconda3/envs/tensorflow/lib/python3.6/site-packages/matplotlib/figure.py", line 2180, in savefig
    self.canvas.print_figure(fname, **kwargs)
  File "/Users/robin/software/anaconda3/envs/tensorflow/lib/python3.6/site-packages/matplotlib/backend_bases.py", line 2082, in print_figure
    **kwargs)
  File "/Users/robin/software/anaconda3/envs/tensorflow/lib/python3.6/site-packages/matplotlib/backends/backend_agg.py", line 579, in print_jpg
    buf, size = self.print_to_buffer()
  File "/Users/robin/software/anaconda3/envs/tensorflow/lib/python3.6/site-packages/matplotlib/backends/backend_agg.py", line 535, in print_to_buffer
    FigureCanvasAgg.draw(self)
  File "/Users/robin/software/anaconda3/envs/tensorflow/lib/python3.6/site-packages/matplotlib/backends/backend_agg.py", line 388, in draw
    self.figure.draw(self.renderer)
  File "/Users/robin/software/anaconda3/envs/tensorflow/lib/python3.6/site-packages/matplotlib/artist.py", line 38, in draw_wrapper
    return draw(artist, renderer, *args, **kwargs)
  File "/Users/robin/software/anaconda3/envs/tensorflow/lib/python3.6/site-packages/matplotlib/figure.py", line 1709, in draw
    renderer, self, artists, self.suppressComposite)
  File "/Users/robin/software/anaconda3/envs/tensorflow/lib/python3.6/site-packages/matplotlib/image.py", line 135, in _draw_list_compositing_images
    a.draw(renderer)
  File "/Users/robin/software/anaconda3/envs/tensorflow/lib/python3.6/site-packages/matplotlib/artist.py", line 38, in draw_wrapper
    return draw(artist, renderer, *args, **kwargs)
  File "/Users/robin/software/anaconda3/envs/tensorflow/lib/python3.6/site-packages/matplotlib/axes/_base.py", line 2607, in draw
    self._update_title_position(renderer)
  File "/Users/robin/software/anaconda3/envs/tensorflow/lib/python3.6/site-packages/matplotlib/axes/_base.py", line 2556, in _update_title_position
    if title.get_window_extent(renderer).ymin < top:
  File "/Users/robin/software/anaconda3/envs/tensorflow/lib/python3.6/site-packages/matplotlib/text.py", line 890, in get_window_extent
    bbox, info, descent = self._get_layout(self._renderer)
  File "/Users/robin/software/anaconda3/envs/tensorflow/lib/python3.6/site-packages/matplotlib/text.py", line 291, in _get_layout
    ismath="TeX" if self.get_usetex() else False)
  File "/Users/robin/software/anaconda3/envs/tensorflow/lib/python3.6/site-packages/matplotlib/backends/backend_agg.py", line 210, in get_text_width_height_descent
    font = self._get_agg_font(prop)
  File "/Users/robin/software/anaconda3/envs/tensorflow/lib/python3.6/site-packages/matplotlib/backends/backend_agg.py", line 250, in _get_agg_font
    font.set_size(size, self.dpi)
RuntimeError: In set_size: Could not set the fontsize

Solution:

The source of the problem is figure_Size and DPI :

The following two codes are different:

figure_size = (6.40, 4.80)
plt.figure(figsize=figure_size, dpi=100)

And:

figure_size = (640, 480)
plt.figure(figsize=figure_size, dpi=1)

Note:

figsize : width, height in inches, default: (6.4, 4.8) , that is, the picture size in inches. The default value in Matplotlib is (6.4, 40.8) DPI : dots (or pixels) per inch, default: 100.0 , that is, the number of pixels per inch. The default value is 100

Although the above two representations seem to be the same, an error is reported by using DPI = 1. (I won’t delve into it for the time being)
Plt.acorr() Function Error: ValueError: object too deep for desired array

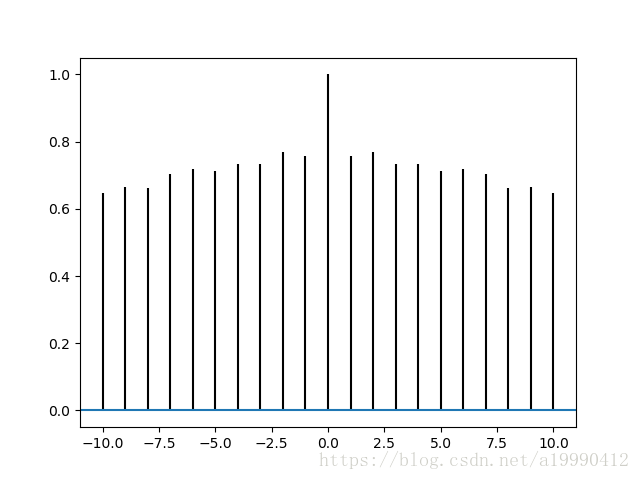
sketch

Note that the input data needs to be one-dimensional. Otherwise, it’s strange to report an error( Don’t ask me why I know)

Correct code:

import matplotlib.pyplot as plt
import numpy as np
data = np.random.random(100)
plt.acorr(data)
plt.show()

Error code:

import matplotlib.pyplot as plt
import numpy as np
data = np.random.random((1, 100))
plt.acorr(data)
plt.show()

[Solved] Matplotlib ERROR: MatplotlibDeprecationWarning: Adding an axes using the same arguments…

Matplotlib error: MatplotlibDeprecationWarning: Adding an axes using the same arguments…
matpltlib error:

MatplotlibDeprecationWarning: Adding an axes using the same arguments as a previous axes currently reuses the earlier instance.  In a future version, a new instance will always be created and returned.  Meanwhile, this warning can be suppressed, and the future behavior ensured, by passing a unique label to each axes instance.
  self.axes = self.fig.add_subplot(111)  # Create a subgraph

The reason is to add subgraphs repeatedly, for example, self.axes = self.fig.add has been used_ Subplot (111) adds a subgraph, and then adds it repeatedly to report an error.

Solution:

Delete the subgraph of figure and add it again. Clear() is the method of figure class. Examples (the following are all examples in the class)

self.fig = plt.figure()
self.axes = self.fig.add_subplot(111)  # Create a subgraph
self.fig.clear() # Clear the subplot first
self.axes = self.fig.add_subplot(111) # Create a subplot

Anaconda Matplotlib drawing Chinese garbled solution

I found a lot of methods to solve the Chinese garbled code of Matplotlib in Anaconda on the Internet. I feel it is not concise enough. Now let’s make a summary. Two steps, one is to find the font, the other is to set it.

1. Font

The system font file is usually saved in the   C:\Windows\Fonts

Open copy any font:

Save it in the TTF folder. Lu Jin’s name is e::’anaconda ‘,’lib’,’site-packages’,’matplotlib ‘,’mpl-data’,’fonts’,’ttf ‘

You can change the file name of Anaconda installed on your computer, and the following path is the same.

So the font is chosen.

2. Setting

Go back to MPL data and open the matplotlibrc file: e:// Anaconda/lib/site packages/Matplotlib/MPL data

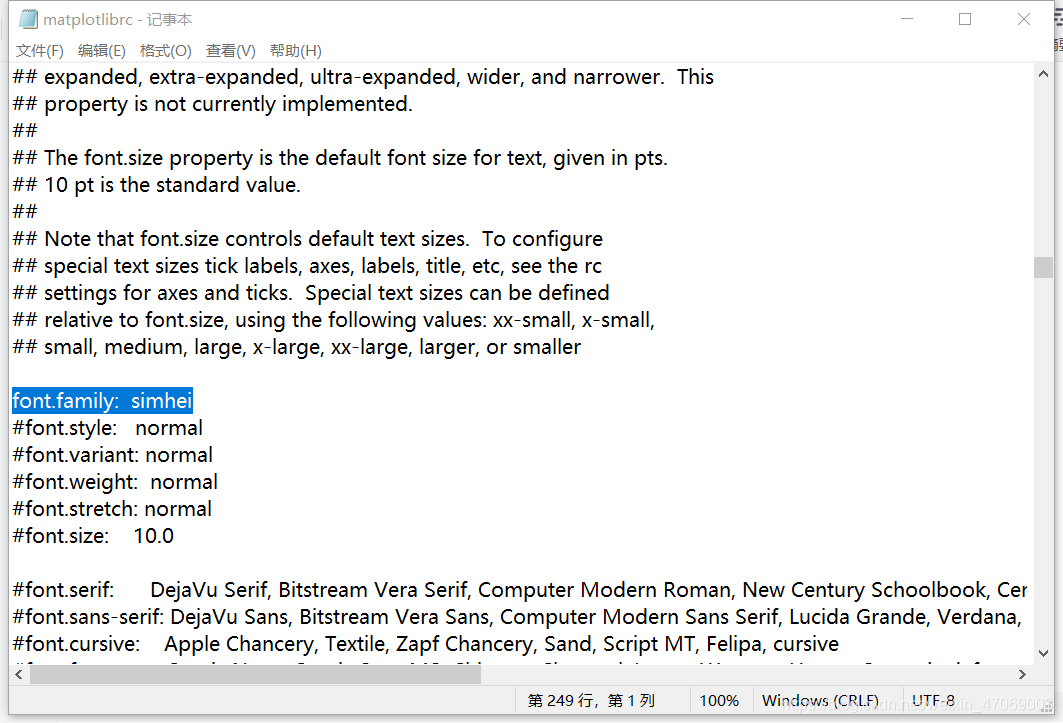
Notepad shows about 249 lines, the upper middle part of the file:

Remove the comment in front of font. Family, and then change the following name to the newly copied font name: simhei.

Save with Ctrl + s and reopen the compiler.

Finally solved the importError: DLLload failed: the specified module could not be found when import matplotlib.pyplot

After all the dependent libraries in Matplotlib (dependent library details: click the open link) were installed successfully, import matplotlib succeeded, but the following error occurred when importing matplotlib.pyplot as PLT:
ImportError: DLLload failed: the specified module
cannot be found
Then I found that the size of matplotlib I installed was 8128 KB, and the same version of Matplotlib I found from another address was 8503 KB. Finally, I uninstalled and reinstalled matplotlib of 8503KB and introduced Matplotlib. pyplot successfully.
J presented here introduced successful version of the download address: https://pypi.org/project/matplotlib/#files
Use administrator privileges to perform the following uninstall:
pip uninstall matplotlib
Reinstall after uninstalling:
pip install matplotlib
Close test effectively
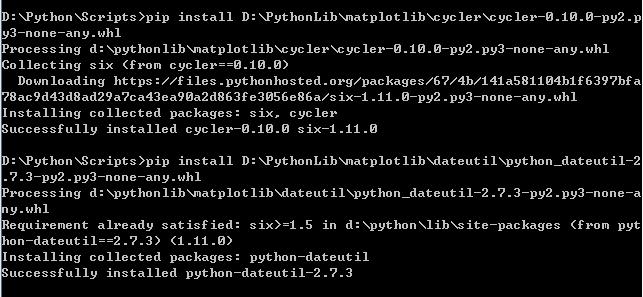
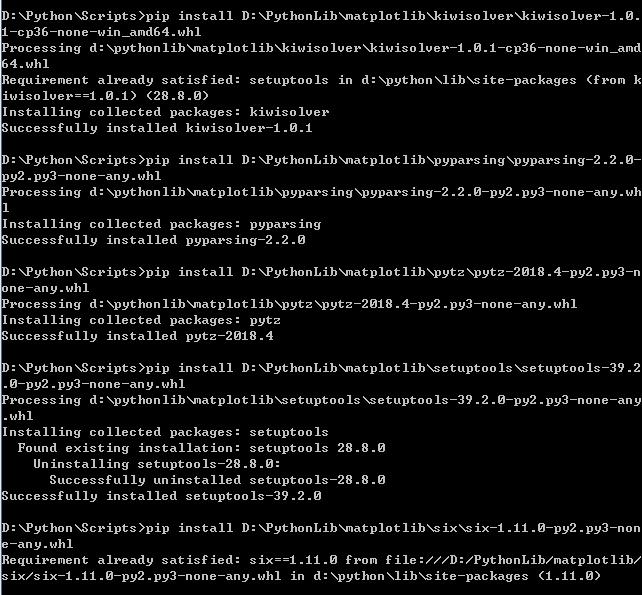
Dependency library installation example:


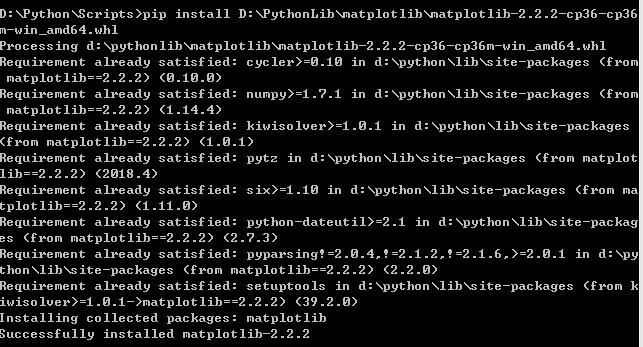
Matplotlib was installed successfully:

[error reported] [Python] [Matplotlib] importerror: failed to import any QT binding

error message

ImportError: Failed to import any qt binding

complete error message:

Traceback (most recent call last):
  File "/home/xovee/Desktop/codes/www20/plot/cascade_plot.py", line 1, in <module>
    import matplotlib.pyplot as plt
  File "/home/xovee/miniconda3/envs/tf-2.0-a0/lib/python3.6/site-packages/matplotlib/pyplot.py", line 2355, in <module>
    switch_backend(rcParams["backend"])
  File "/home/xovee/miniconda3/envs/tf-2.0-a0/lib/python3.6/site-packages/matplotlib/pyplot.py", line 221, in switch_backend
    backend_mod = importlib.import_module(backend_name)
  File "/home/xovee/miniconda3/envs/tf-2.0-a0/lib/python3.6/importlib/__init__.py", line 126, in import_module
    return _bootstrap._gcd_import(name[level:], package, level)
  File "/home/xovee/miniconda3/envs/tf-2.0-a0/lib/python3.6/site-packages/matplotlib/backends/backend_qt4agg.py", line 5, in <module>
    from .backend_qt5agg import (
  File "/home/xovee/miniconda3/envs/tf-2.0-a0/lib/python3.6/site-packages/matplotlib/backends/backend_qt5agg.py", line 11, in <module>
    from .backend_qt5 import (
  File "/home/xovee/miniconda3/envs/tf-2.0-a0/lib/python3.6/site-packages/matplotlib/backends/backend_qt5.py", line 15, in <module>
    import matplotlib.backends.qt_editor.figureoptions as figureoptions
  File "/home/xovee/miniconda3/envs/tf-2.0-a0/lib/python3.6/site-packages/matplotlib/backends/qt_editor/figureoptions.py", line 13, in <module>
    from matplotlib.backends.qt_compat import QtGui
  File "/home/xovee/miniconda3/envs/tf-2.0-a0/lib/python3.6/site-packages/matplotlib/backends/qt_compat.py", line 158, in <module>
    raise ImportError("Failed to import any qt binding")
ImportError: Failed to import any qt binding

environment

  • Ubuntu 18.4 LTS
  • Python 3.6
  • Matplotlib 3.1.1

    solution

    pip install PyQt5
    

    <标题>引用

      <> Foad。(2018年11月22日)。导入任何qt绑定、Python – Tensorflow失败。李从https://stackoverflow.com/questions/52346254/importerror-failed-to-import-any-qt-binding-python-tensorflow获取