catalogue
The following operations are carried out under the windows environment.
one Change single slash to double slash
2. The modified path is in English
3. Delete CV2. Imshow ()
When I use CV2 to save pictures to a new price asking folder, I report an error CV2. Error: opencv (4.5.1) C: \ users \ appveyor \ appdata \ local \ temp \ 1 \ PIP req build
The solution is as follows:
The following operations are carried out under the windows environment.
one Change single slash to double slash
Some people on the Internet say that the path reading error is caused by the number in the path. Correction method: change the single slash in the path into double slash.
For example:
cv2.imwrite(save_dir + '\\' + img_name, img)
However, the same error is reported later, so read the following comments for 2 operations:
2. The modified path is in English
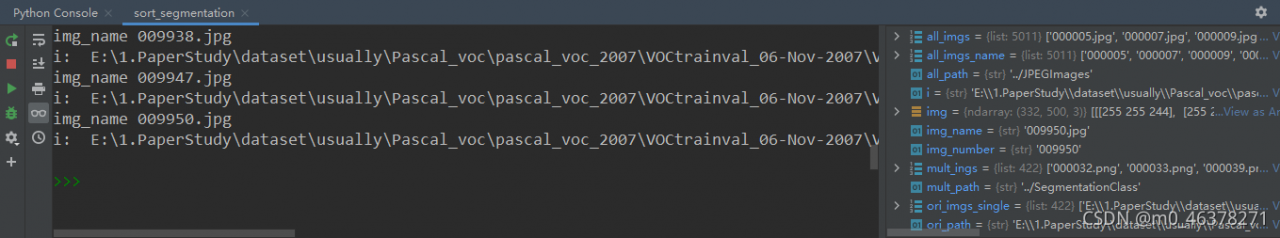
I reported a similar error here because Chinese appears in the quoted picture path. If you change the picture path to an all English path, there will be no problem.
for i in ori_imgs_single:
    img_name = i.split('\\')[-1]
    img = cv2.imread(i)
    cv2.imwrite(save_dir + '\\' + img_name, img)
print('save OK!')
OK:
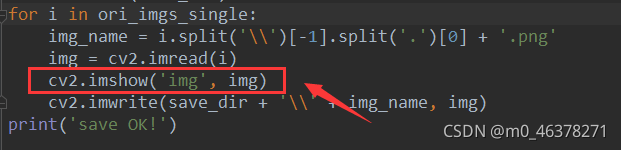
3. Delete CV2. Imshow ()
Maybe there is something wrong with my environment. If you still report an error, try deleting CV2. Imshow (). If I delete it, it will be OK:
OK: