Recently in the paper matlab generated height field, online search a lot, do a small summary of their own.
First, if you want to add colorbar to the generated image, you can do it in two ways:
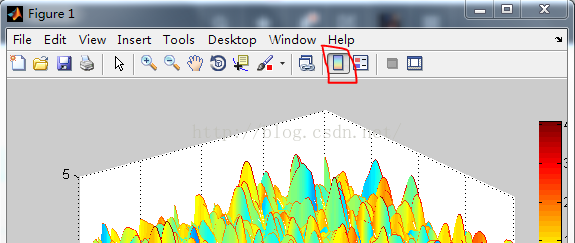
1: Insert — Colorbar in the menu bar of the generated Figure image, or click on the shortcut area at the top to add Colorbar, as shown below:
2: Directly from the command line
colorbar;
If you want to specify the location at will:
colorbar('position',[0.95 0.1 0.04 0.8]);
The data in square brackets refer to the x-coordinate, y-coordinate, width, and height of the colorbar bottom-left point. You can try to change the data and see what happens.
Second, sometimes the resulting colorbar is not what we want it to be. How can we arbitrarily adjust the range and position of the colorbar?
Here is a control method for a program statement:
1、set(a, 'CLim', [0 1]);
2、caxis([0,1]);
before colorbar, you can set its upper and lower limits, usually the second method is relatively simple!
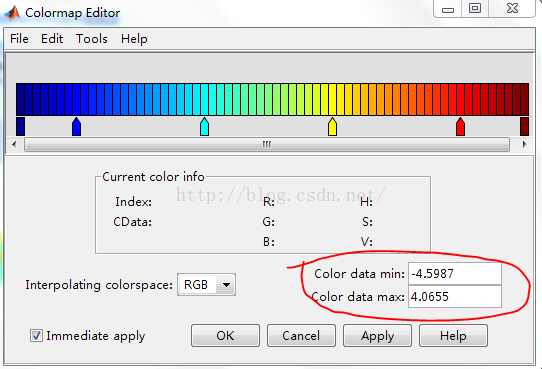
To adjust the value range of the colorbar, right-click on it and select Launch ColorMap Editor
So we want our colorbar to be as big, as long, as big, as wide as we want, and that’s pretty easy!
Click ColorBar, right-click — select Show Property Editor
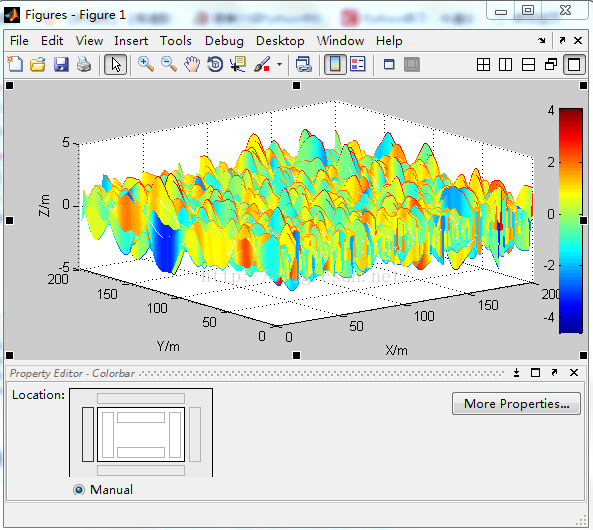
Click on each of the small rectangles in Location to let our Colorbar position change.
We can even click colorbar in the image

Feel free to drag and resize.