import matplotlib.pyplot as plt
import numpy as np
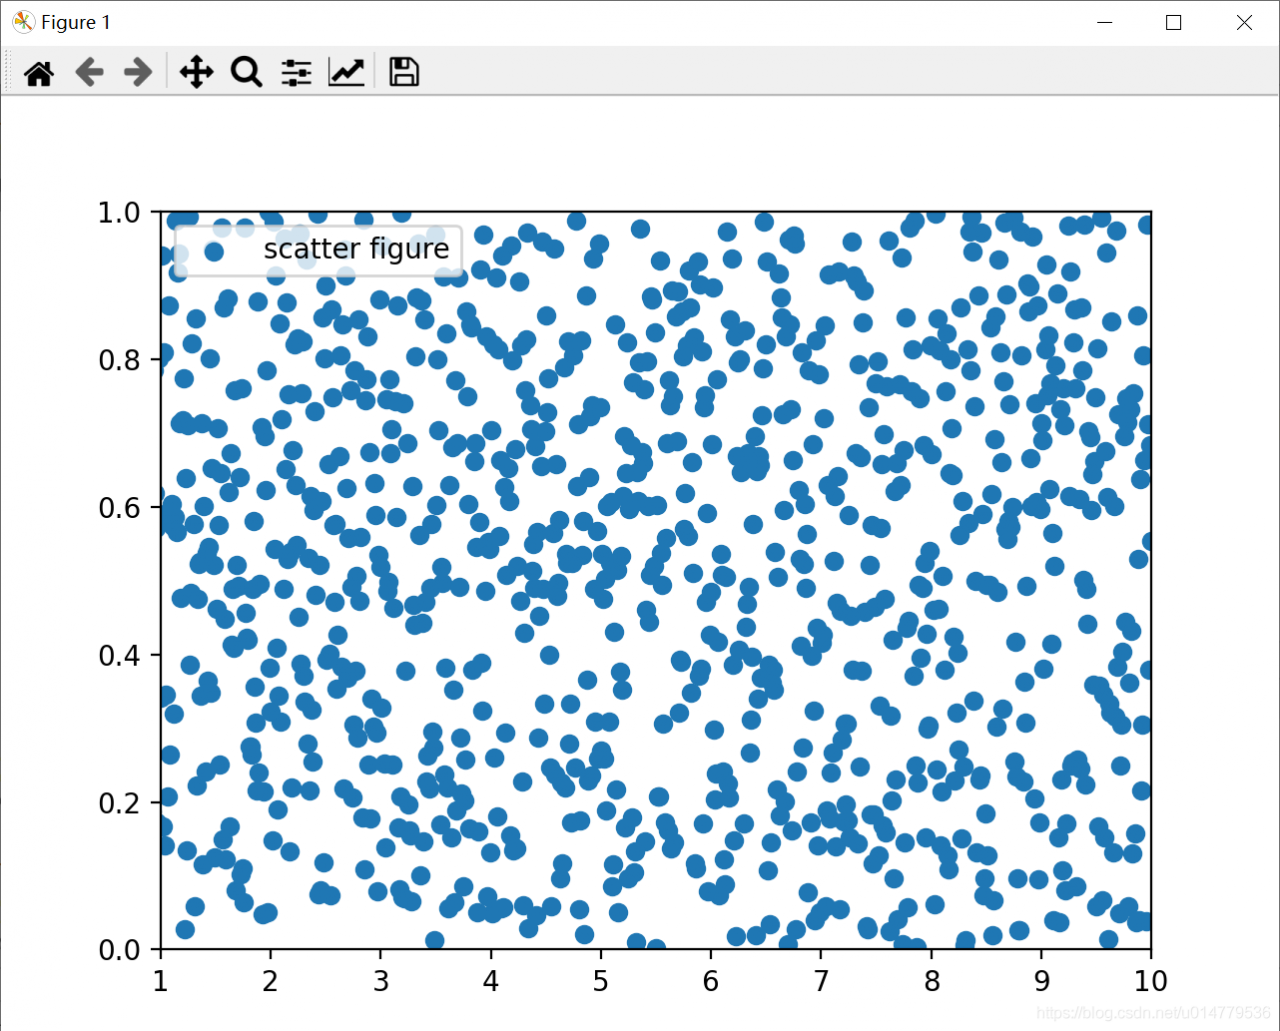
x = np.linspace(0.05,10,1000)
y = np.random.rand(1000)
plt.scatter(x,y,label="scatter figure")
plt.legend()
plt.xlim(1,10)
plt.ylim(0,1)
plt.show()
Read More:
- Import Matplotlib.pyplot as plt Error KeyError: ‘pylab’
- “Typeerror: invalid dimensions for image data” in Matplotlib drawing imshow() function
- Python — using Matplotlib to draw histogram
- Apawn class, add axis mapping to control apawn movement
- valueError: Length mismatch: Expected axis has 40 elements, new values have 38 elements
- How to Fix IWAB0489E Error when deploying Web service to Axis runtime
- Resolve call‘ plt.show () ‘no image after
- plt.show () and plt.imshow The difference between ()
- plt.plot and plt.imshow difference
- matplotlib 1.3.1 requires nose, which is not installed. matplotlib 1.3.1 requires tornado, which is
- Struts 2 encapsulates form data into list and map sets
- Finally solved the importError: DLLload failed: the specified module could not be found when import matplotlib.pyplot
- Solving attributeerror: module ‘Matplotlib’ has no attribute ‘plot‘
- Solving attributeerror: module ‘Matplotlib’ has no attribute ‘artist’
- matplotlib error – no module named tkinter
- Matlab draw logarithmic coordinates!
- Python combined with Matplotlib to add button
- Visualization of training process based on tensorboard on Python
- Error in installing Matplotlib Library: permissionerror: [errno 13] permission denied: ‘/ usr / local / lib / python3.6’
- Anaconda Matplotlib drawing Chinese garbled solution