https://automatetheboringstuff.com/chapter12/
https://automatetheboringstuff.com/chapter12/
Working with Excel Spreadsheets
Excel is a popular and powerful spreadsheet application for Windows. The openpyxlmodule allows your Python programs to read and modify Excel spreadsheet files. For example, you might have the boring task of copying certain data from one spreadsheet and pasting it into another one. Or you might have to go through thousands of rows and pick out just a handful of them to make small edits based on some criteria. Or you might have to look through hundreds of spreadsheets of department budgets, searching for any that are in the red. These are exactly the sort of boring, mindless spreadsheet tasks that Python can do for you.
Although Excel is proprietary software from Microsoft, there are free alternatives that run on Windows, OS X, and Linux. Both LibreOffice Calc and OpenOffice Calc work with Excel’s . xlsx file format for spreadsheets, which means the openpyxlmodule can work on spreadsheets from these applications as well. You can download the software from https://www.libreoffice.org/ and http://www.openoffice.org/, respectively. Even if you already have Excel installed on your computer, you may find these programs easier to use. The screenshots in this chapter, however, are all from Excel 2010 on Windows 7.
Excel Documents
First, let’s go over some basic definitions: An Excel spreadsheet document is called a workbook. A single workbook is saved in a file with the .xlsx extension. Each workbook can contain multiple sheets (also called worksheets). The sheet the user is currently viewing (or last viewed before closing Excel) is called the active sheet.
Each sheet has columns (addressed by letters starting at A) and rows (addressed by numbers starting at 1). A box at a particular column and row is called a cell. Each cell can contain a number or text value. The grid of cells with data makes up a sheet.
Installing the openpyxl Module
Python does not come with OpenPyXL, so you’ll have to install it. Follow the instructions for installing third-party modules in Appendix A; the name of the module is openpyxl. To test whether it is installed correctly, enter the following into the interactive shell:
>>> import openpyxl
If the module was correctly installed, this should produce no error messages. Remember to import the openpyxl module before running the interactive shell examples in this chapter, or you’ll get a NameError: name 'openpyxl' is not definederror.
This book covers version 2.3.3 of OpenPyXL, but new versions are regularly released by the OpenPyXL team. Don’t worry, though: New versions should stay backward compatible with the instructions in this book for quite some time. If you have a newer version and want to see what additional features may be available to you, you can check out the full documentation for OpenPyXL at http://openpyxl.readthedocs.org/.
Reading Excel Documents
The examples in this chapter will use a spreadsheet named example. xlsx stored in the root folder. You can either create the spreadsheet yourself or download it from http://nostarch.com/automatestuff/. Figure 12-1 shows the tabs for the three default sheets named Sheet1, Sheet2, and Sheet3 that Excel automatically provides for new workbooks. (The number of default sheets created may vary between operating systems and spreadsheet programs.)
Figure 12-1. The tabs for a workbook’s sheets are in the lower-left corner of Excel.
Sheet 1 in the example file should look like Table 12-1. (If you didn’t download example. xlsx from the website, you should enter this data into the sheet yourself.)
Table 12-1. The example.xlsx Spreadsheet
| |
A |
B |
C |
| 1 |
4/5/2015 1:34:02 PM |
Apples |
73 |
| 2 |
4/5/2015 3:41:23 AM |
Cherries |
85 |
| 3 |
4/6/2015 12:46:51 PM |
Pears |
14 |
| 4 |
4/8/2015 8:59:43 AM |
Oranges |
52 |
| 5 |
4/10/2015 2:07:00 AM |
Apples |
152 |
| 6 |
4/10/2015 6:10:37 PM |
Bananas |
23 |
| 7 |
4/10/2015 2:40:46 AM |
Strawberries |
98 |
Now that we have our example spreadsheet, let’s see how we can manipulate it with the openpyxl module.
Opening Excel Documents with OpenPyXL
Once you’ve imported the openpyxl module, you’ll be able to use the openpyxl.load_workbook() function. Enter the following into the interactive shell:
>>> import openpyxl
>>> wb = openpyxl.load_workbook('example.xlsx')
>>> type(wb)
<class 'openpyxl.workbook.workbook.Workbook'>
The openpyxl.load_workbook() function takes in the filename and returns a value of the workbook data type. This Workbook object represents the Excel file, a bit like how a File object represents an opened text file.
Remember that example. xlsx needs to be in the current working directory in order for you to work with it. You can find out what the current working directory is by importing os and using os.getcwd(), and you can change the current working directory using os.chdir().
Getting Sheets from the Workbook
You can get a list of all the sheet names in the workbook by calling the get_sheet_names() method. Enter the following into the interactive shell:
>>> import openpyxl
>>> wb = openpyxl.load_workbook('example.xlsx')
>>> wb.get_sheet_names()
['Sheet1', 'Sheet2', 'Sheet3']
>>> sheet = wb.get_sheet_by_name('Sheet3')
>>> sheet
<Worksheet "Sheet3">
>>> type(sheet) <class 'openpyxl.worksheet.worksheet.Worksheet'>
>>> sheet.title
'Sheet3'
>>> anotherSheet = wb.active
>>> anotherSheet
<Worksheet "Sheet1">
Each sheet is represented by a Worksheet object, which you can obtain by passing the sheet name string to the get_sheet_by_name() workbook method. Finally, you can read the active member variable of a Workbook object to get the workbook’s active sheet. The active sheet is the sheet that’s on top when the workbook is opened in Excel. Once you have the Worksheet object, you can get its name from the titleattribute.
Getting Cells from the Sheets
Once you have a Worksheet object, you can access a Cell object by its name. Enter the following into the interactive shell:
>>> import openpyxl
>>> wb = openpyxl.load_workbook('example.xlsx')
>>> sheet = wb.get_sheet_by_name('Sheet1')
>>> sheet['A1']
<Cell Sheet1.A1>
>>> sheet['A1'].value
datetime.datetime(2015, 4, 5, 13, 34, 2)
>>> c = sheet['B1']
>>> c.value
'Apples'
>>> 'Row ' + str(c.row) + ', Column ' + c.column + ' is ' + c.value
'Row 1, Column B is Apples'
>>> 'Cell ' + c.coordinate + ' is ' + c.value
'Cell B1 is Apples'
>>> sheet['C1'].value
73
The Cell object has a value attribute that contains, unsurprisingly, the value stored in that cell. Cell objects also have row, column, and coordinate attributes that provide location information for the cell.
Here, accessing the value attribute of our Cell object for cell B1 gives us the string 'Apples'. The row attribute gives us the integer 1, the column attribute gives us 'B', and the coordinate attribute gives us 'B1'.
OpenPyXL will automatically interpret the dates in column A and return them as datetime values rather than strings. The datetime data type is explained further in Chapter 16.
Specifying a column by letter can be tricky to program, especially because after column Z, the columns start by using two letters: AA, AB, AC, and so on. As an alternative, you can also get a cell using the sheet’s cell() method and passing integers for its row and column keyword arguments. The first row or column integer is 1, not 0. Continue the interactive shell example by entering the following:
>>> sheet.cell(row=1, column=2)
<Cell Sheet1.B1>
>>> sheet.cell(row=1, column=2).value
'Apples'
>>> for i in range(1, 8, 2):
        print(i, sheet.cell(row=i, column=2).value)

1 Apples
3 Pears
5 Apples
7 Strawberries
As you can see, using the sheet’s cell() method and passing it row=1 and column=2gets you a Cell object for cell B1, just like specifying sheet['B1'] did. Then, using the cell() method and its keyword arguments, you can write a for loop to print the values of a series of cells.
Say you want to go down column B and print the value in every cell with an odd row number. By passing 2 for the range() function’s “step” parameter, you can get cells from every second row (in this case, all the odd-numbered rows). The forloop’s i variable is passed for the row keyword argument to the cell() method, while 2 is always passed for the column keyword argument. Note that the integer 2, not the string 'B', is passed.
You can determine the size of the sheet with the Worksheet object’s max_row and max_column member variables. Enter the following into the interactive shell:
>>> import openpyxl
>>> wb = openpyxl.load_workbook('example.xlsx')
>>> sheet = wb.get_sheet_by_name('Sheet1')
>>> sheet.max_row
7
>>> sheet.max_column
3
Note that the max_column method returns an integer rather than the letter that appears in Excel.
Converting Between Column Letters and Numbers
To convert from letters to numbers, call the openpyxl.cell.column_index_from_string()function. To convert from numbers to letters, call the openpyxl.cell.get_column_letter() function. Enter the following into the interactive shell:
>>> import openpyxl
>>> from openpyxl.cell import get_column_letter, column_index_from_string
>>> get_column_letter(1)
'A'
>>> get_column_letter(2)
'B'
>>> get_column_letter(27)
'AA'
>>> get_column_letter(900)
'AHP'
>>> wb = openpyxl.load_workbook('example.xlsx')
>>> sheet = wb.get_sheet_by_name('Sheet1')
>>> get_column_letter(sheet.max_column)
'C'
>>> column_index_from_string('A')
1
>>> column_index_from_string('AA')
27
After you import these two functions from the openpyxl. cell module, you can call get_column_letter() and pass it an integer like 27 to figure out what the letter name of the 27th column is. The function column_index_string() does the reverse: You pass it the letter name of a column, and it tells you what number that column is. You don’t need to have a workbook loaded to use these functions. If you want, you can load a workbook, get a Worksheet object, and call a Worksheet object method like max_column to get an integer. Then, you can pass that integer to get_column_letter().
Getting Rows and Columns from the Sheets
You can slice Worksheet objects to get all the Cell objects in a row, column, or rectangular area of the spreadsheet. Then you can loop over all the cells in the slice. Enter the following into the interactive shell:
   >>> import openpyxl
   >>> wb = openpyxl.load_workbook('example.xlsx')
   >>> sheet = wb.get_sheet_by_name('Sheet1')
   >>> tuple(sheet['A1':'C3'])
   ((<Cell Sheet1.A1>, <Cell Sheet1.B1>, <Cell Sheet1.C1>), (<Cell Sheet1.A2>,
   <Cell Sheet1.B2>, <Cell Sheet1.C2>), (<Cell Sheet1.A3>, <Cell Sheet1.B3>,
   <Cell Sheet1.C3>))
❶ >>> for rowOfCellObjects in sheet['A1':'C3']:
❷         for cellObj in rowOfCellObjects:
               print(cellObj.coordinate, cellObj.value)
           print('--- END OF ROW ---')
   A1 2015-04-05 13:34:02
   B1 Apples
   C1 73
   --- END OF ROW ---
   A2 2015-04-05 03:41:23
   B2 Cherries
   C2 85
   --- END OF ROW ---
   A3 2015-04-06 12:46:51
   B3 Pears
   C3 14
   --- END OF ROW ---
Here, we specify that we want the Cell objects in the rectangular area from A1 to C3, and we get a Generator object containing the Cell objects in that area. To help us visualize this Generator object, we can use tuple() on it to display its Cell objects in a tuple.
This tuple contains three tuples: one for each row, from the top of the desired area to the bottom. Each of these three inner tuples contains the Cell objects in one row of our desired area, from the leftmost cell to the right. So overall, our slice of the sheet contains all the Cell objects in the area from A1 to C3, starting from the top-left cell and ending with the bottom-right cell.
To print the values of each cell in the area, we use two for loops. The outer for loop goes over each row in the slice ❶. Then, for each row, the nested for loop goes through each cell in that row ❷.
To access the values of cells in a particular row or column, you can also use a Worksheet object’s rows and columns attribute. Enter the following into the interactive shell:
>>> import openpyxl
>>> wb = openpyxl.load_workbook('example.xlsx')
>>> sheet = wb.active
>>> sheet.columns[1]
(<Cell Sheet1.B1>, <Cell Sheet1.B2>, <Cell Sheet1.B3>, <Cell Sheet1.B4>,
<Cell Sheet1.B5>, <Cell Sheet1.B6>, <Cell Sheet1.B7>)
>>> for cellObj in sheet.columns[1]:
        print(cellObj.value)

Apples
Cherries
Pears
Oranges
Apples
Bananas
Strawberries
Using the rows attribute on a Worksheet object will give you a tuple of tuples. Each of these inner tuples represents a row, and contains the Cell objects in that row. The columns attribute also gives you a tuple of tuples, with each of the inner tuples containing the Cell objects in a particular column. For example. xlsx, since there are 7 rows and 3 columns, rows gives us a tuple of 7 tuples (each containing 3 Cellobjects), and columns gives us a tuple of 3 tuples (each containing 7 Cell objects).
To access one particular tuple, you can refer to it by its index in the larger tuple. For example, to get the tuple that represents column B, you use sheet.columns[1]. To get the tuple containing the Cell objects in column A, you’d use sheet.columns[0]. Once you have a tuple representing one row or column, you can loop through its Cell objects and print their values.
Workbooks, Sheets, Cells
As a quick review, here’s a rundown of all the functions, methods, and data types involved in reading a cell out of a spreadsheet file:
Import the openpyxl module. Call the openpyxl.load_workbook() function. Get a Workbook object. Read the active member variable or call the get_sheet_by_name() workbook method. Get a Worksheet object. Use indexing or the cell() sheet method with row and column keyword arguments. Get a Cell object. Read the Cell object’s value attribute.
Project: Reading Data from a Spreadsheet
Say you have a spreadsheet of data from the 2010 US Census and you have the boring task of going through its thousands of rows to count both the total population and the number of census tracts for each county. (A census tract is simply a geographic area defined for the purposes of the census.) Each row represents a single census tract. We’ll name the spreadsheet file censuspopdata. xlsx, and you can download it from http://nostarch.com/automatestuff/. Its contents look like Figure 12-2.
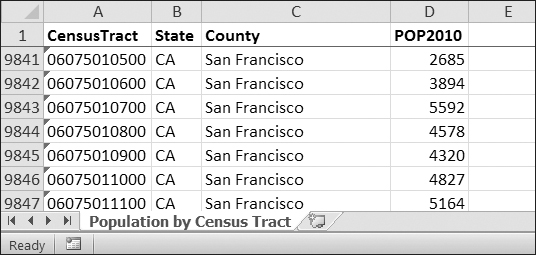
Figure 12-2. The censuspopdata.xlsx spreadsheet
Even though Excel can calculate the sum of multiple selected cells, you’d still have to select the cells for each of the 3,000-plus counties. Even if it takes just a few seconds to calculate a county’s population by hand, this would take hours to do for the whole spreadsheet.
In this project, you’ll write a script that can read from the census spreadsheet file and calculate statistics for each county in a matter of seconds.
This is what your program does:
Reads the data from the Excel spreadsheet. Counts the number of census tracts in each county. Counts the total population of each county. Prints the results.
This means your code will need to do the following:
Open and read the cells of an Excel document with the openpyxl module. Calculate all the tract and population data and store it in a data structure. Write the data structure to a text file with the . py extension using the pprintmodule.
Step 1: Read the Spreadsheet Data
There is just one sheet in the censuspopdata. xlsx spreadsheet, named 'Population by Census Tract', and each row holds the data for a single census tract. The columns are the tract number (A), the state abbreviation (B), the county name (C), and the population of the tract (D).
Open a new file editor window and enter the following code. Save the file as readCensusExcel.py.
   #! python3
   # readCensusExcel.py - Tabulates population and number of census tracts for
   # each county.

❶ import openpyxl, pprint
   print('Opening workbook...')
❷ wb = openpyxl.load_workbook('censuspopdata.xlsx')
❸ sheet = wb.get_sheet_by_name('Population by Census Tract')
   countyData = {}

   # TODO: Fill in countyData with each county's population and tracts.
   print('Reading rows...')
❹ for row in range(2, sheet.max_row + 1):
       # Each row in the spreadsheet has data for one census tract.
       state  = sheet['B' + str(row)].value
       county = sheet['C' + str(row)].value
       pop    = sheet['D' + str(row)].value

   # TODO: Open a new text file and write the contents of countyData to it.
This code imports the openpyxl module, as well as the pprint module that you’ll use to print the final county data ❶. Then it opens the censuspopdata. xlsx file ❷, gets the sheet with the census data ❸, and begins iterating over its rows ❹.
Note that you’ve also created a variable named countyData, which will contain the populations and number of tracts you calculate for each county. Before you can store anything in it, though, you should determine exactly how you’ll structure the data inside it.
Step 2: Populate the Data Structure
The data structure stored in countyData will be a dictionary with state abbreviations as its keys. Each state abbreviation will map to another dictionary, whose keys are strings of the county names in that state. Each county name will in turn map to a dictionary with just two keys, 'tracts' and 'pop'. These keys map to the number of census tracts and population for the county. For example, the dictionary will look similar to this:
{'AK': {'Aleutians East': {'pop': 3141, 'tracts': 1},
        'Aleutians West': {'pop': 5561, 'tracts': 2},
        'Anchorage': {'pop': 291826, 'tracts': 55},
        'Bethel': {'pop': 17013, 'tracts': 3},
        'Bristol Bay': {'pop': 997, 'tracts': 1},
        --snip--
If the previous dictionary were stored in countyData, the following expressions would evaluate like this:
>>> countyData['AK']['Anchorage']['pop']
291826
>>> countyData['AK']['Anchorage']['tracts']
55
More generally, the countyData dictionary’s keys will look like this:
countyData[state abbrev][county]['tracts']
countyData[state abbrev][county]['pop']
Now that you know how countyData will be structured, you can write the code that will fill it with the county data. Add the following code to the bottom of your program:
   #! python 3
   # readCensusExcel.py - Tabulates population and number of census tracts for
   # each county.

   --snip--
   for row in range(2, sheet.max_row + 1):
       # Each row in the spreadsheet has data for one census tract.
       state  = sheet['B' + str(row)].value
       county = sheet['C' + str(row)].value
       pop    = sheet['D' + str(row)].value

       # Make sure the key for this state exists.
❶     countyData.setdefault(state, {})
       # Make sure the key for this county in this state exists.
❷     countyData[state].setdefault(county, {'tracts': 0, 'pop': 0})

       # Each row represents one census tract, so increment by one.
❸     countyData[state][county]['tracts'] += 1
       # Increase the county pop by the pop in this census tract.
❹     countyData[state][county]['pop'] += int(pop)

   # TODO: Open a new text file and write the contents of countyData to it.
The last two lines of code perform the actual calculation work, incrementing the value for tracts ❸ and increasing the value for pop ❹ for the current county on each iteration of the for loop.
The other code is there because you cannot add a county dictionary as the value for a state abbreviation key until the key itself exists in countyData. (That is, countyData['AK']['Anchorage']['tracts'] += 1 will cause an error if the 'AK' key doesn’t exist yet.) To make sure the state abbreviation key exists in your data structure, you need to call the setdefault() method to set a value if one does not already exist for state ❶.
Just as the countyData dictionary needs a dictionary as the value for each state abbreviation key, each of those dictionaries will need its own dictionary as the value for each county key ❷. And each of those dictionaries in turn will need keys 'tracts' and 'pop' that start with the integer value 0. (If you ever lose track of the dictionary structure, look back at the example dictionary at the start of this section.)
Since setdefault() will do nothing if the key already exists, you can call it on every iteration of the for loop without a problem.
Step 3: Write the Results to a File
After the for loop has finished, the countyData dictionary will contain all of the population and tract information keyed by county and state. At this point, you could program more code to write this to a text file or another Excel spreadsheet. For now, let’s just use the pprint.pformat() function to write the countyData dictionary value as a massive string to a file named census2010.py. Add the following code to the bottom of your program (making sure to keep it unindented so that it stays outside the for loop):
#! python 3
# readCensusExcel.py - Tabulates population and number of census tracts for
# each county.get_active_sheet
--snip--

for row in range(2, sheet.max_row + 1):
--snip--

# Open a new text file and write the contents of countyData to it.
print('Writing results...')
resultFile = open('census2010.py', 'w')
resultFile.write('allData = ' + pprint.pformat(countyData))
resultFile.close()
print('Done.')
The pprint.pformat() function produces a string that itself is formatted as valid Python code. By outputting it to a text file named census2010. py, you’ve generated a Python program from your Python program! This may seem complicated, but the advantage is that you can now import census2010. py just like any other Python module. In the interactive shell, change the current working directory to the folder with your newly created census2010. py file (on my laptop, this is C:\Python34), and then import it:
>>> import os
>>> os.chdir('C:\\Python34')
>>> import census2010
>>> census2010.allData['AK']['Anchorage']
{'pop': 291826, 'tracts': 55}
>>> anchoragePop = census2010.allData['AK']['Anchorage']['pop']
>>> print('The 2010 population of Anchorage was ' + str(anchoragePop))
The 2010 population of Anchorage was 291826
The readCensusExcel. py program was throwaway code: Once you have its results saved to census2010. py, you won’t need to run the program again. Whenever you need the county data, you can just run import census2010.
Calculating this data by hand would have taken hours; this program did it in a few seconds. Using OpenPyXL, you will have no trouble extracting information that is saved to an Excel spreadsheet and performing calculations on it. You can download the complete program from http://nostarch.com/automatestuff/.
Ideas for Similar Programs
Many businesses and offices use Excel to store various types of data, and it’s not uncommon for spreadsheets to become large and unwieldy. Any program that parses an Excel spreadsheet has a similar structure: It loads the spreadsheet file, preps some variables or data structures, and then loops through each of the rows in the spreadsheet. Such a program could do the following:
Compare data across multiple rows in a spreadsheet. Open multiple Excel files and compare data between spreadsheets. Check whether a spreadsheet has blank rows or invalid data in any cells and alert the user if it does. Read data from a spreadsheet and use it as the input for your Python programs.
Writing Excel Documents
OpenPyXL also provides ways of writing data, meaning that your programs can create and edit spreadsheet files. With Python, it’s simple to create spreadsheets with thousands of rows of data.
Creating and Saving Excel Documents
Call the openpyxl.Workbook() function to create a new, blank Workbook object. Enter the following into the interactive shell:
>>> import openpyxl
>>> wb = openpyxl.Workbook()
>>> wb.get_sheet_names()
['Sheet']
>>> sheet = wb.active
>>> sheet.title
'Sheet'
>>> sheet.title = 'Spam Bacon Eggs Sheet'
>>> wb.get_sheet_names()
['Spam Bacon Eggs Sheet']
The workbook will start off with a single sheet named Sheet. You can change the name of the sheet by storing a new string in its title attribute.
Any time you modify the Workbook object or its sheets and cells, the spreadsheet file will not be saved until you call the save() workbook method. Enter the following into the interactive shell (with example. xlsx in the current working directory):
>>> import openpyxl
>>> wb = openpyxl.load_workbook('example.xlsx')
>>> sheet = wb.active
>>> sheet.title = 'Spam Spam Spam'
>>> wb.save('example_copy.xlsx')
Here, we change the name of our sheet. To save our changes, we pass a filename as a string to the save() method. Passing a different filename than the original, such as 'example_copy. xlsx', saves the changes to a copy of the spreadsheet.
Whenever you edit a spreadsheet you’ve loaded from a file, you should always save the new, edited spreadsheet to a different filename than the original. That way, you’ll still have the original spreadsheet file to work with in case a bug in your code caused the new, saved file to have incorrect or corrupt data.
Creating and Removing Sheets
Sheets can be added to and removed from a workbook with the create_sheet() and remove_sheet() methods. Enter the following into the interactive shell:
>>> import openpyxl
>>> wb = openpyxl.Workbook()
>>> wb.get_sheet_names()
['Sheet']
>>> wb.create_sheet()
<Worksheet "Sheet1">
>>> wb.get_sheet_names()
['Sheet', 'Sheet1']
>>> wb.create_sheet(index=0, title='First Sheet')
<Worksheet "First Sheet">
>>> wb.get_sheet_names()
['First Sheet', 'Sheet', 'Sheet1']
>>> wb.create_sheet(index=2, title='Middle Sheet')
<Worksheet "Middle Sheet">
>>> wb.get_sheet_names()
['First Sheet', 'Sheet', 'Middle Sheet', 'Sheet1']
The create_sheet() method returns a new Worksheet object named SheetX, which by default is set to be the last sheet in the workbook. Optionally, the index and name of the new sheet can be specified with the index and title keyword arguments.
Continue the previous example by entering the following:
>>> wb.get_sheet_names()
['First Sheet', 'Sheet', 'Middle Sheet', 'Sheet1']
>>> wb.remove_sheet(wb.get_sheet_by_name('Middle Sheet'))
>>> wb.remove_sheet(wb.get_sheet_by_name('Sheet1'))
>>> wb.get_sheet_names()
['First Sheet', 'Sheet']
The remove_sheet() method takes a Worksheet object, not a string of the sheet name, as its argument. If you know only the name of a sheet you want to remove, call get_sheet_by_name() and pass its return value into remove_sheet().
Remember to call the save() method to save the changes after adding sheets to or removing sheets from the workbook.
Writing Values to Cells
Writing values to cells is much like writing values to keys in a dictionary. Enter this into the interactive shell:
>>> import openpyxl
>>> wb = openpyxl.Workbook()
>>> sheet = wb.get_sheet_by_name('Sheet')
>>> sheet['A1'] = 'Hello world!'
>>> sheet['A1'].value
'Hello world!'
If you have the cell’s coordinate as a string, you can use it just like a dictionary key on the Worksheet object to specify which cell to write to.
Project: Updating a Spreadsheet
In this project, you’ll write a program to update cells in a spreadsheet of produce sales. Your program will look through the spreadsheet, find specific kinds of produce, and update their prices. Download this spreadsheet from http://nostarch.com/automatestuff/. Figure 12-3 shows what the spreadsheet looks like.
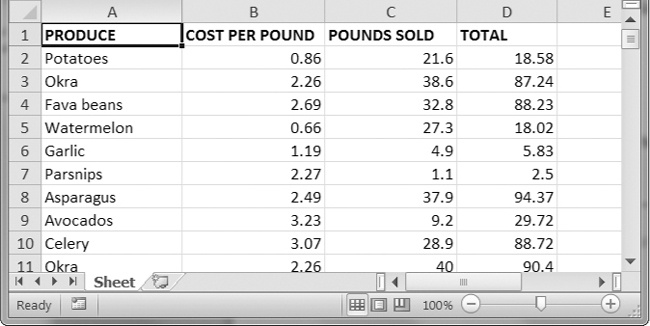
Figure 12-3. A spreadsheet of produce sales
Each row represents an individual sale. The columns are the type of produce sold (A), the cost per pound of that produce (B), the number of pounds sold (C), and the total revenue from the sale (D). The TOTAL column is set to the Excel formula =ROUND(B3*C3, 2), which multiplies the cost per pound by the number of pounds sold and rounds the result to the nearest cent. With this formula, the cells in the TOTAL column will automatically update themselves if there is a change in column B or C.
Now imagine that the prices of garlic, celery, and lemons were entered incorrectly, leaving you with the boring task of going through thousands of rows in this spreadsheet to update the cost per pound for any garlic, celery, and lemon rows. You can’t do a simple find-and-replace for the price because there might be other items with the same price that you don’t want to mistakenly “correct. ” For thousands of rows, this would take hours to do by hand. But you can write a program that can accomplish this in seconds.
Your program does the following:
Loops over all the rows. If the row is for garlic, celery, or lemons, changes the price.
This means your code will need to do the following:
Open the spreadsheet file. For each row, check whether the value in column A is Celery, Garlic, or Lemon. If it is, update the price in column B. Save the spreadsheet to a new file (so that you don’t lose the old spreadsheet, just in case).
Step 1: Set Up a Data Structure with the Update Information
The prices that you need to update are as follows:
| Celery |
1.19 |
| Garlic |
3.07 |
| Lemon |
1.27 |
You could write code like this:
if produceName == 'Celery':
    cellObj = 1.19
if produceName == 'Garlic':
    cellObj = 3.07
if produceName == 'Lemon':
    cellObj = 1.27
Having the produce and updated price data hardcoded like this is a bit inelegant. If you needed to update the spreadsheet again with different prices or different produce, you would have to change a lot of the code. Every time you change code, you risk introducing bugs.
A more flexible solution is to store the corrected price information in a dictionary and write your code to use this data structure. In a new file editor window, enter the following code:
#! python3
# updateProduce.py - Corrects costs in produce sales spreadsheet.

import openpyxl

wb = openpyxl.load_workbook('produceSales.xlsx')
sheet = wb.get_sheet_by_name('Sheet')

# The produce types and their updated prices
PRICE_UPDATES = {'Garlic': 3.07,
                 'Celery': 1.19,
                 'Lemon': 1.27}

# TODO: Loop through the rows and update the prices.
Save this as updateProduce.py. If you need to update the spreadsheet again, you’ll need to update only the PRICE_UPDATES dictionary, not any other code.
Step 2: Check All Rows and Update Incorrect Prices
The next part of the program will loop through all the rows in the spreadsheet. Add the following code to the bottom of updateProduce.py:
   #! python3
   # updateProduce.py - Corrects costs in produce sales spreadsheet.

   --snip--

   # Loop through the rows and update the prices.
❶ for rowNum in range(2, sheet.max_row):  # skip the first row
❷     produceName = sheet.cell(row=rowNum, column=1).value
❸     if produceName in PRICE_UPDATES:
           sheet.cell(row=rowNum, column=2).value = PRICE_UPDATES[produceName]

❹ wb.save('updatedProduceSales.xlsx')
We loop through the rows starting at row 2, since row 1 is just the header ❶. The cell in column 1 (that is, column A) will be stored in the variable produceName ❷. If produceName exists as a key in the PRICE_UPDATES dictionary ❸, then you know this is a row that must have its price corrected. The correct price will be in PRICE_UPDATES[produceName].
Notice how clean using PRICE_UPDATES makes the code. Only one if statement, rather than code like if produceName == 'Garlic':, is necessary for every type of produce to update. And since the code uses the PRICE_UPDATES dictionary instead of hardcoding the produce names and updated costs into the for loop, you modify only the PRICE_UPDATES dictionary and not the code if the produce sales spreadsheet needs additional changes.
After going through the entire spreadsheet and making changes, the code saves the Workbook object to updatedProduceSales.xlsx ❹. It doesn’t overwrite the old spreadsheet just in case there’s a bug in your program and the updated spreadsheet is wrong. After checking that the updated spreadsheet looks right, you can delete the old spreadsheet.
You can download the complete source code for this program from http://nostarch.com/automatestuff/.
Ideas for Similar Programs
Since many office workers use Excel spreadsheets all the time, a program that can automatically edit and write Excel files could be really useful. Such a program could do the following:
Read data from one spreadsheet and write it to parts of other spreadsheets. Read data from websites, text files, or the clipboard and write it to a spreadsheet. Automatically “clean up” data in spreadsheets. For example, it could use regular expressions to read multiple formats of phone numbers and edit them to a single, standard format.
Setting the Font Style of Cells
Styling certain cells, rows, or columns can help you emphasize important areas in your spreadsheet. In the produce spreadsheet, for example, your program could apply bold text to the potato, garlic, and parsnip rows. Or perhaps you want to italicize every row with a cost per pound greater than $5. Styling parts of a large spreadsheet by hand would be tedious, but your programs can do it instantly.
To customize font styles in cells, important, import the Font() function from the openpyxl.styles module.
from openpyxl.styles import Font
This allows you to type Font() instead of openpyxl.styles.Font(). (See Importing Modules to review this style of import statement.)
Here’s an example that creates a new workbook and sets cell A1 to have a 24-point, italicized font. Enter the following into the interactive shell:
   >>> import openpyxl
   >>> from openpyxl.styles import Font
   >>> wb = openpyxl.Workbook()
   >>> sheet = wb.get_sheet_by_name('Sheet')
❶ >>> italic24Font = Font(size=24, italic=True)
❷ >>> sheet['A1'].font = italic24Font
   >>> sheet['A1'] = 'Hello world!'
   >>> wb.save('styled.xlsx')
A cell’s style can be set by assigning the Font object to the style attribute.
In this example, Font(size=24, italic=True) returns a Font object, which is stored in italic24Font ❶. The keyword arguments to Font(), size and italic, configure the Fontobject. And when fontObj is assigned to the cell’s font attribute ❷, all that font styling information gets applied to cell A1.
Font Objects
To set font style attributes, you pass keyword arguments to Font(). Table 12-2shows the possible keyword arguments for the Font() function.
Table 12-2. Keyword Arguments for Font style Attributes
| Keyword argument |
Data type |
Description |
name |
String |
The font name, such as 'Calibri' or 'Times New Roman' |
size |
Integer |
The point size |
bold |
Boolean |
True, for bold font |
italic |
Boolean |
True, for italic font |
You can call Font() to create a Font object and store that Font object in a variable. You then pass that to Style(), store the resulting Style object in a variable, and assign that variable to a Cell object’s style attribute. For example, this code creates various font styles:
>>> import openpyxl
>>> from openpyxl.styles import Font
>>> wb = openpyxl.Workbook()
>>> sheet = wb.get_sheet_by_name('Sheet')

>>> fontObj1 = Font(name='Times New Roman', bold=True)
>>> sheet['A1'].font = fontObj1
>>> sheet['A1'] = 'Bold Times New Roman'

>>> fontObj2 = Font(size=24, italic=True)
>>> sheet['B3'].font = fontObj2
>>> sheet['B3'] = '24 pt Italic'

>>> wb.save('styles.xlsx')
Here, we store a Font object in fontObj1 and then set the A1 Cell object’s fontattribute to fontObj1. We repeat the process with another Font object to set the style of a second cell. After you run this code, the styles of the A1 and B3 cells in the spreadsheet will be set to custom font styles, as shown in Figure 12-4.
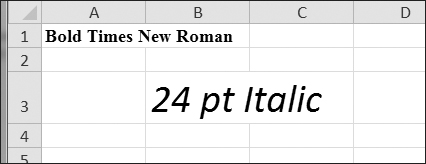
Figure 12-4. A spreadsheet with custom font styles
For cell A1, we set the font name to 'Times New Roman' and set bold to true, so our text appears in bold Times New Roman. We didn’t specify a size, so the openpyxl default, 11, is used. In cell B3, our text is italic, with a size of 24; we didn’t specify a font name, so the openpyxl default, Calibri, is used.
Formulas
Formulas, which begin with an equal sign, can configure cells to contain values calculated from other cells. In this section, you’ll use the openpyxl module to programmatically add formulas to cells, just like any normal value. For example:
>>> sheet['B9'] = '=SUM(B1:B8)'
This will store =SUM(B1:B8) as the value in cell B9. This sets the B9 cell to a formula that calculates the sum of values in cells B1 to B8. You can see this in action in Figure 12-5.
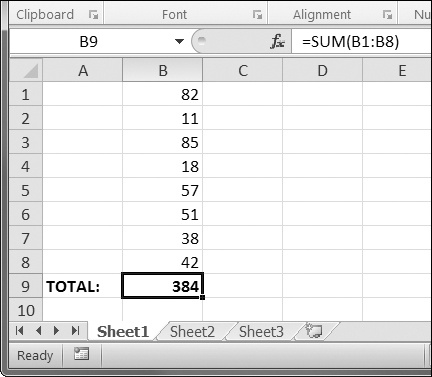
Figure 12-5. Cell B9 contains the formula =SUM(B1:B8), which adds the cells B1 to B8.
A formula is set just like any other text value in a cell. Enter the following into the interactive shell:
>>> import openpyxl
>>> wb = openpyxl.Workbook()
>>> sheet = wb.active
>>> sheet['A1'] = 200
>>> sheet['A2'] = 300
>>> sheet['A3'] = '=SUM(A1:A2)'
>>> wb.save('writeFormula.xlsx')
The cells in A1 and A2 are set to 200 and 300, respectively. The value in cell A3 is set to a formula that sums the values in A1 and A2. When the spreadsheet is opened in Excel, A3 will display its value as 500.
Excel formulas offer a level of programmability for spreadsheets but can quickly become unmanageable for complicated tasks. For example, even if you’re deeply familiar with Excel formulas, it’s a headache to try to decipher what =IFERROR(TRIM(IF(LEN(VLOOKUP(F7, Sheet2! $A$1:$B$10000, 2, FALSE))>0,SUBSTITUTE(VLOOKUP(F7, Sheet2! $A$1:$B$10000, 2, FALSE), “ ”, “”),“”)), “”) actually does. Python code is much more readable.
Adjusting Rows and Columns
In Excel, adjusting the sizes of rows and columns is as easy as clicking and dragging the edges of a row or column header. But if you need to set a row or column’s size based on its cells’ contents or if you want to set sizes in a large number of spreadsheet files, it will be much quicker to write a Python program to do it.
Rows and columns can also be hidden entirely from view. Or they can be “frozen” in place so that they are always visible on the screen and appear on every page when the spreadsheet is printed (which is handy for headers).
Setting Row Height and Column Width
Worksheet objects have row_dimensions and column_dimensions attributes that control row heights and column widths. Enter this into the interactive shell:
>>> import openpyxl
>>> wb = openpyxl.Workbook()
>>> sheet = wb.active
>>> sheet['A1'] = 'Tall row'
>>> sheet['B2'] = 'Wide column'
>>> sheet.row_dimensions[1].height = 70
>>> sheet.column_dimensions['B'].width = 20
>>> wb.save('dimensions.xlsx')
A sheet’s row_dimensions and column_dimensions are dictionary-like values; row_dimensions contains RowDimension objects and column_dimensions contains ColumnDimension objects. In row_dimensions, you can access one of the objects using the number of the row (in this case, 1 or 2). In column_dimensions, you can access one of the objects using the letter of the column (in this case, A or B).
The dimensions. xlsx spreadsheet looks like Figure 12-6.
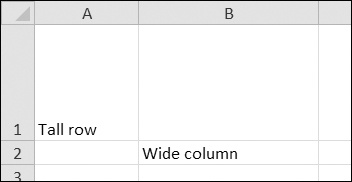
Figure 12-6. Row 1 and column B set to larger heights and widths
Once you have the RowDimension object, you can set its height. Once you have the ColumnDimension object, you can set its width. The row height can be set to an integer or float value between 0 and 409. This value represents the height measured in points, where one point equals 1/72 of an inch. The default row height is 12.75. The column width can be set to an integer or float value between 0 and 255. This value represents the number of characters at the default font size (11 point) that can be displayed in the cell. The default column width is 8.43 characters. Columns with widths of 0 or rows with heights of 0 are hidden from the user.
Merging and Unmerging Cells
A rectangular area of cells can be merged into a single cell with the merge_cells()sheet method. Enter the following into the interactive shell:
>>> import openpyxl
>>> wb = openpyxl.Workbook()
>>> sheet = wb.active
>>> sheet.merge_cells('A1:D3')
>>> sheet['A1'] = 'Twelve cells merged together.'
>>> sheet.merge_cells('C5:D5')
>>> sheet['C5'] = 'Two merged cells.'
>>> wb.save('merged.xlsx')
The argument to merge_cells() is a single string of the top-left and bottom-right cells of the rectangular area to be merged: 'A1:D3' merges 12 cells into a single cell. To set the value of these merged cells, simply set the value of the top-left cell of the merged group.
When you run this code, merged. xlsx will look like Figure 12-7.
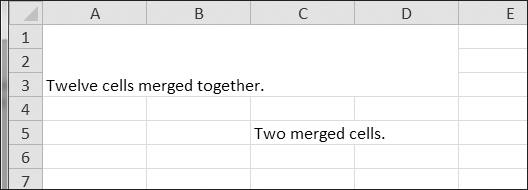
Figure 12-7. Merged cells in a spreadsheet
To unmerge cells, call the unmerge_cells() sheet method. Enter this into the interactive shell.
>>> import openpyxl
>>> wb = openpyxl.load_workbook('merged.xlsx')
>>> sheet = wb.active
>>> sheet.unmerge_cells('A1:D3')
>>> sheet.unmerge_cells('C5:D5')
>>> wb.save('merged.xlsx')
If you save your changes and then take a look at the spreadsheet, you’ll see that the merged cells have gone back to being individual cells.
Freeze Panes
For spreadsheets too large to be displayed all at once, it’s helpful to “freeze” a few of the top rows or leftmost columns onscreen. Frozen column or row headers, for example, are always visible to the user even as they scroll through the spreadsheet. These are known as freeze panes. In OpenPyXL, each Worksheet object has a freeze_panes attribute that can be set to a Cell object or a string of a cell’s coordinates. Note that all rows above and all columns to the left of this cell will be frozen, but the row and column of the cell itself will not be frozen.
To unfreeze all panes, set freeze_panes to None or 'A1'. Table 12-3 shows which rows and columns will be frozen for some example settings of freeze_panes.
Table 12-3. Frozen Pane Examples
freeze_panes setting |
Rows and columns frozen |
sheet.freeze_panes = 'A2' |
Row 1 |
sheet.freeze_panes = 'B1' |
Column A |
sheet.freeze_panes = 'C1' |
Columns A and B |
sheet.freeze_panes = 'C2' |
Row 1 and columns A and B |
sheet.freeze_panes = 'A1' or sheet.freeze_panes = None |
No frozen panes |
Make sure you have the produce sales spreadsheet from http://nostarch.com/automatestuff/. Then enter the following into the interactive shell:
>>> import openpyxl
>>> wb = openpyxl.load_workbook('produceSales.xlsx')
>>> sheet = wb.active
>>> sheet.freeze_panes = 'A2'
>>> wb.save('freezeExample.xlsx')
If you set the freeze_panes attribute to 'A2', row 1 will always be viewable, no matter where the user scrolls in the spreadsheet. You can see this in Figure 12-8.
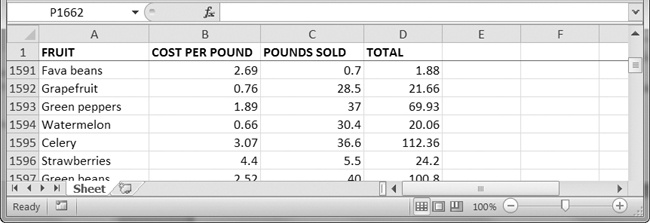
Figure 12-8. With freeze_panes set to 'A2', row 1 is always visible even as the user scrolls down.
Charts
OpenPyXL supports creating bar, line, scatter, and pie charts using the data in a sheet’s cells. To make a chart, you need to do the following:
Create a Reference object from a rectangular selection of cells. Create a Series object by passing in the Reference object. Create a Chart object. Append the Series object to the Chart object. Add the Chart object to the Worksheet object, optionally specifying which cell the top left corner of the chart should be positioned..
The Reference object requires some explaining. Reference objects are created by calling the openpyxl.chart.Reference() function and passing three arguments:
The Worksheet object containing your chart data. A tuple of two integers, representing the top-left cell of the rectangular selection of cells containing your chart data: The first integer in the tuple is the row, and the second is the column. Note that 1 is the first row, not 0. A tuple of two integers, representing the bottom-right cell of the rectangular selection of cells containing your chart data: The first integer in the tuple is the row, and the second is the column.
Figure 12-9 shows some sample coordinate arguments.
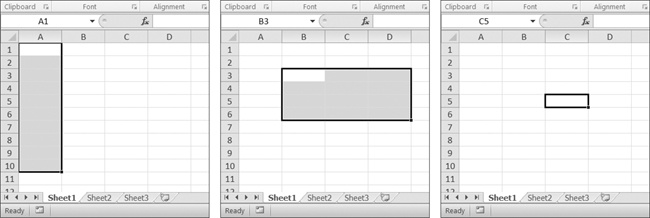
Figure 12-9. From left to right: (1, 1), (10, 1); (3, 2), (6, 4); (5, 3), (5, 3)
Enter this interactive shell example to create a bar chart and add it to the spreadsheet:
>>> import openpyxl
>>> wb = openpyxl.Workbook()
>>> sheet = wb.active
>>> for i in range(1, 11):         # create some data in column A
        sheet['A' + str(i)] = i

>>> refObj = openpyxl.chart.Reference(sheet, min_col=1, min_row=1, max_col=1, max_row=10)

>>> seriesObj = openpyxl.chart.Series(refObj, title='First series')

>>> chartObj = openpyxl.chart.BarChart()
>>> chartObj.title = 'My Chart'
>>> chartObj.append(seriesObj)
>>> sheet.add_chart(chartObj, 'C5')
>>> wb.save('sampleChart.xlsx')
This produces a spreadsheet that looks like Figure 12-10.
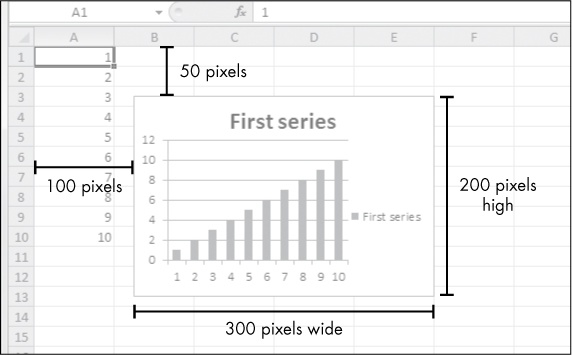
Figure 12-10. A spreadsheet with a chart added
We’ve created a bar chart by calling openpyxl.chart.BarChart(). You can also create line charts, scatter charts, and pie charts by calling openpyxl.chart.LineChart(), openpyxl.chart.ScatterChart(), and openpyxl.chart.PieChart().
Unfortunately, in the current version of OpenPyXL (2.3.3), the load_workbook()function does not load charts in Excel files. Even if the Excel file has charts, the loaded Workbook object will not include them. If you load a Workbook object and immediately save it to the same . xlsx filename, you will effectively remove the charts from it.
Summary
Often the hard part of processing information isn’t the processing itself but simply getting the data in the right format for your program. But once you have your spreadsheet loaded into Python, you can extract and manipulate its data much faster than you could by hand.
You can also generate spreadsheets as output from your programs. So if colleagues need your text file or PDF of thousands of sales contacts transferred to a spreadsheet file, you won’t have to tediously copy and paste it all into Excel.
Equipped with the openpyxl module and some programming knowledge, you’ll find processing even the biggest spreadsheets a piece of cake.
Practice Questions
For the following questions, imagine you have a Workbook object in the variable wb, a Worksheet object in sheet, a Cell object in cell, a Comment object in comm, and an Imageobject in img.
| Q: |
1. What does the openpyxl.load_workbook() function return? |
| Q: |
2. What does the get_sheet_names() workbook method return? |
| Q: |
3. How would you retrieve the Worksheet object for a sheet named 'Sheet1'? |
| Q: |
4. How would you retrieve the Worksheet object for the workbook’s active sheet? |
| Q: |
5. How would you retrieve the value in the cell C5? |
| Q: |
6. How would you set the value in the cell C5 to "Hello"? |
| Q: |
7. How would you retrieve the cell’s row and column as integers? |
| Q: |
8. What do the max_column and max_row sheet methods return, and what is the data type of these return values? |
| Q: |
9. If you needed to get the integer index for column 'M', what function would you need to call? |
| Q: |
10. If you needed to get the string name for column 14, what function would you need to call? |
| Q: |
11. How can you retrieve a tuple of all the Cell objects from A1 to F1? |
| Q: |
12. How would you save the workbook to the filename example.xlsx? |
| Q: |
13. How do you set a formula in a cell? |
| Q: |
15. How would you set the height of row 5 to 100? |
| Q: |
16. How would you hide column C? |
| Q: |
17. Name a few features that OpenPyXL 2.3.3 does not load from a spreadsheet file. |
| Q: |
18. What is a freeze pane? |
| Q: |
19. What five functions and methods do you have to call to create a bar chart? |
Practice Projects
For practice, write programs that perform the following tasks.
Multiplication Table Maker
Create a program multiplicationTable. py that takes a number N from the command line and creates an N×N multiplication table in an Excel spreadsheet. For example, when the program is run like this:
py multiplicationTable.py 6
… it should create a spreadsheet that looks like Figure 12-11.
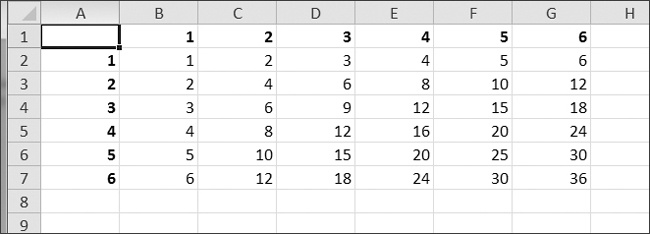
Figure 12-11. A multiplication table generated in a spreadsheet
Row 1 and column A should be used for labels and should be in bold.
Blank Row Inserter
Create a program blankRowInserter. py that takes two integers and a filename string as command line arguments. Let’s call the first integer N and the second integer M. Starting at row N, the program should insert M blank rows into the spreadsheet. For example, when the program is run like this:
python blankRowInserter.py 3 2 myProduce.xlsx
… the “before” and “after” spreadsheets should look like Figure 12-12.
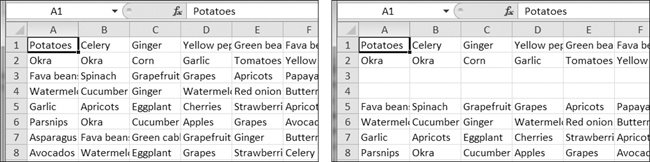
Figure 12-12. Before (left) and after (right) the two blank rows are inserted at row 3
You can write this program by reading in the contents of the spreadsheet. Then, when writing out the new spreadsheet, use a for loop to copy the first N lines. For the remaining lines, add M to the row number in the output spreadsheet.
Spreadsheet Cell Inverter
Write a program to invert the row and column of the cells in the spreadsheet. For example, the value at row 5, column 3 will be at row 3, column 5 (and vice versa). This should be done for all cells in the spreadsheet. For example, the “before” and “after” spreadsheets would look something like Figure 12-13.
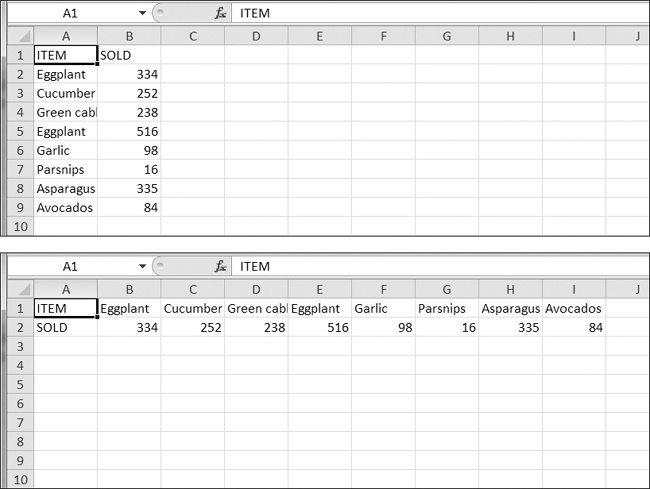
Figure 12-13. The spreadsheet before (top) and after (bottom) inversion
You can write this program by using nested for loops to read in the spreadsheet’s data into a list of lists data structure. This data structure could have sheetData[x][y]for the cell at column x and row y. Then, when writing out the new spreadsheet, use sheetData[y][x] for the cell at column x and row y.
Text Files to Spreadsheet
Write a program to read in the contents of several text files (you can make the text files yourself) and insert those contents into a spreadsheet, with one line of text per row. The lines of the first text file will be in the cells of column A, the lines of the second text file will be in the cells of column B, and so on.
Use the readlines() File object method to return a list of strings, one string per line in the file. For the first file, output the first line to column 1, row 1. The second line should be written to column 1, row 2, and so on. The next file that is read with readlines() will be written to column 2, the next file to column 3, and so on.
Spreadsheet to Text Files
Write a program that performs the tasks of the previous program in reverse order: The program should open a spreadsheet and write the cells of column A into one text file, the cells of column B into another text file, and so on.


Support the author by purchasing the print & ebook bundle from
No Starch Press