Tag Archives: r language

error: XML error: target ‘vdb‘ duplicated for disk sources ‘aaa.img‘ and ‘bbb.img‘

On a Sunday morning when you want to learn, try adding a hard disk to the KVM virtual machine with the command line.
create a disk
#qemu-img create – F qcow2/home/KVM FS/sy-b80915disk1.qcow2 10g

Bind disk to domain: sy-b80915
#virsh attach disk sy-b80915/home/KVM FS/sy-b80915disk1.qcow2 VDB — live — config

Later, I tried to unbind the VDA of the main disk. As a result, I accidentally unbind the VDA of the main disk
#virsh detach disk sy-b80915 VDA — live — config

But I unbound VDB, namely sy-b80915disk1.qcow2
#virsh detach disk sy-b80915 VDB — live — config

The virtual machine can still be restarted and used normally later, but I think the name of sy-b80915disk1.qcow2 is not good. Delete and recreate sy-b80915vdb.qcow2
#rm – RF/home/KVM/sy-b80915disk1.qcow2
#qemu-img create – F qcow2/home/KVM FS/sy-b80915vdb.qcow2 10g

Then bind
#virsh attach disk sy-b80915/home/KVM FS/sy-b80915vdb.qcow2 VDB — live — config
the results are as follows:
error: XML error: target ‘VDB’ duplicated for disk sources’ sy-b80915disk1. Img ‘and’ sy-b80915vdb. Img ‘
the big idea is to bind repeatedly, but it has been unbound before.

The only exception is that the main disk VDA is unbound accidentally, but the system can still run. So I checked the XML file. Compared with other virtual machines, I found that the XML file of SY – b80915 lacks the main disk VDA. When unbinding the VDA, the XML file is changed. So add VDA to the XML file again
execute the following command to edit the XML file:
#virsh edit sy-b80915
repair the XML definition of VDA, as shown in Figure 1:
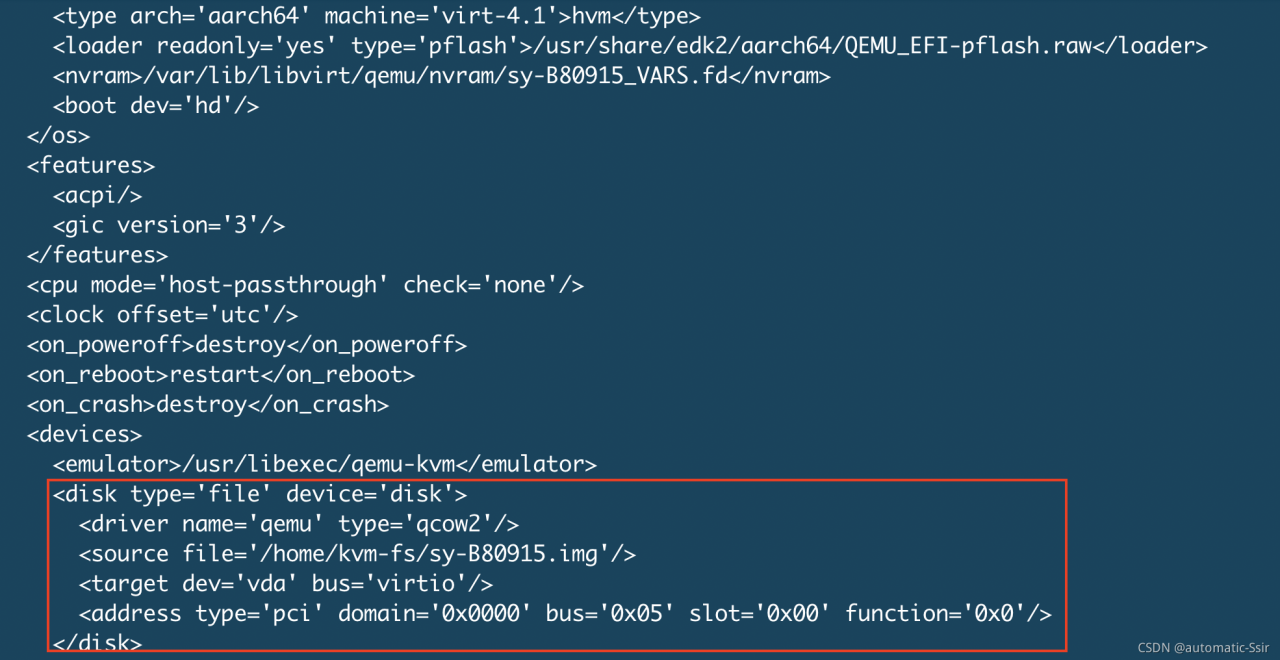
Figure 1

Then bind sy-b80915vdb.qcow2 again. Success
#virsh attach-disk sy-B80915 /home/kvm-fs/sy-B80915vdb.qcow2 vdb –live –config

[Local Precompilation Error] do not set execute permissions for source files

1. Problem occurrence scenario

I created three new files under the project file. When submitting the code, I precompiled the script locally, and three errors occurred: do not set execute permissions for source files. Each file corresponds to one such error.

2. Understanding of error reporting

Do not set execute permissions for source files: do not set executable permissions for source files
understanding: you need to change the permission of the file to non-executable
for the understanding of file permissions, see how to understand file permission settings in this blog – 644 755 777, etc

3. Solution

1) On the console, after entering the file directory, enter
LS – L
to view the current permissions of the file. It is found that the file has “executable permissions”: X (generally 755)

2) Enter Chmod < File permission type, generally changed to 644><File name>

Error: The size of the connection buffer (131072) was not large enough

R language, carry out geo data mining and analysis, Download geo data online,

gset <- getGEO("GSE94994", GSEMatrix =TRUE, AnnotGPL=FALSE)

The following error is reported:

Found 1 file(s)
GSE94994_series_matrix.txt.gz
Using locally cached version: C:\Users\ENMONS~1\AppData\Local\Temp\Rtmpe27iLR/GSE94994_series_matrix.txt.gz
Error: The size of the connection buffer (131072) was not large enough
to fit a complete line:
  * Increase it by setting `Sys.setenv("VROOM_CONNECTION_SIZE")`

Rstido’s default link cache is 131072 bytes. After conversion, it is 131kb, 0.131mb

  But the size of the data you downloaded & gt; 131072 bytes, so we need to adjust the default connection cache for normal download

resolvent:

Sys.setenv("VROOM_CONNECTION_SIZE"=99999999)

  Code implementation:

> gset <- getGEO("GSE94994", GSEMatrix =TRUE, AnnotGPL=FALSE)
Found 1 file(s)
GSE94994_series_matrix.txt.gz
Using locally cached version: C:\Users\ENMONS~1\AppData\Local\Temp\Rtmpe27iLR/GSE94994_series_matrix.txt.gz
Error: The size of the connection buffer (111) was not large enough
to fit a complete line:
  * Increase it by setting `Sys.setenv("VROOM_CONNECTION_SIZE")`
> Sys.setenv("VROOM_CONNECTION_SIZE"=99999999)
> gset <- getGEO("GSE94994", GSEMatrix =TRUE, AnnotGPL=FALSE)
Found 1 file(s)
GSE94994_series_matrix.txt.gz
Using locally cached version: C:\Users\ENMONS~1\AppData\Local\Temp\Rtmpe27iLR/GSE94994_series_matrix.txt.gz
Rows: 18 Columns: 160                                                                                                         
 0s-- Column specification --------------------------------------------------------------------------------------------------------
Delimiter: "\t"
chr   (1): ID_REF
dbl (159): GSM2493904, GSM2493905, GSM2493906, GSM2493907, GSM2493908, GSM2493909, GSM2493910, GSM2493911, GSM2493912, GSM24...

i Use `spec()` to retrieve the full column specification for this data.
i Specify the column types or set `show_col_types = FALSE` to quiet this message.
Using locally cached version of GPL23075 found here:
C:\Users\ENMONS~1\AppData\Local\Temp\Rtmpe27iLR/GPL23075.soft 

Error in plot.new() : figure margins too large

Error in plot.new() : figure margins too large

Full error:


#Question

Fit the regression model and calculate the dfbetas value of each sample and the optimal dfbetas threshold. Finally, visualize the impact of each sample on each predictive variable;

#fit a regression model
model <- lm(mpg~disp+hp, data=mtcars)

#view model summary
summary(model)

#calculate DFBETAS for each observation in the model
dfbetas <- as.data.frame(dfbetas(model))

#display DFBETAS for each observation
dfbetas

#find number of observations
n <- nrow(mtcars)

#calculate DFBETAS threshold value
thresh <- 2/sqrt(n)

thresh

#specify 2 rows and 1 column in plotting region

#dev.off()
#par(mar = c(1, 1, 1, 1))

par(mfrow=c(2,1))

#plot DFBETAS for disp with threshold lines
plot(dfbetas$disp, type='h')
abline(h = thresh, lty = 2)
abline(h = -thresh, lty = 2)

#plot DFBETAS for hp with threshold lines 
plot(dfbetas$hp, type='h')
abline(h = thresh, lty = 2)
abline(h = -thresh, lty = 2)

#Solution
par(mar = c(1, 1, 1, 1))

#fit a regression model
model <- lm(mpg~disp+hp, data=mtcars)

#view model summary
summary(model)

#calculate DFBETAS for each observation in the model
dfbetas <- as.data.frame(dfbetas(model))

#display DFBETAS for each observation
dfbetas

#find number of observations
n <- nrow(mtcars)

#calculate DFBETAS threshold value
thresh <- 2/sqrt(n)

thresh

#specify 2 rows and 1 column in plotting region

#dev.off()
par(mar = c(1, 1, 1, 1))

par(mfrow=c(2,1))

#plot DFBETAS for disp with threshold lines
plot(dfbetas$disp, type='h')
abline(h = thresh, lty = 2)
abline(h = -thresh, lty = 2)

#plot DFBETAS for hp with threshold lines 
plot(dfbetas$hp, type='h')
abline(h = thresh, lty = 2)
abline(h = -thresh, lty = 2)


Full Error Message:
> par(mfrow=c(2,1))
>
> #plot DFBETAS for disp with threshold lines
> plot(dfbetas$disp, type=’h’)
Error in plot.new() : figure margins too large
> abline(h = thresh, lty = 2)
Error in int_abline(a = a, b = b, h = h, v = v, untf = untf, …) :
plot.new has not been called yet
> abline(h = -thresh, lty = 2)
Error in int_abline(a = a, b = b, h = h, v = v, untf = untf, …) :
plot.new has not been called yet
>
> #plot DFBETAS for hp with threshold lines
> plot(dfbetas$hp, type=’h’)
Error in plot.new() : figure margins too large
> abline(h = thresh, lty = 2)
Error in int_abline(a = a, b = b, h = h, v = v, untf = untf, …) :
plot.new has not been called yet
> abline(h = -thresh, lty = 2)
Error in int_abline(a = a, b = b, h = h, v = v, untf = untf, …) :
plot.new has not been called yet

Error in *** : subscript out of bounds [How to Solve]

Error in *** : subscript out of bounds

Full error:


Question:

The data is out of bounds. Except for others, who knows where it is? Do you ask memory? Who do you ask?

#make this example reproducible
set.seed(0)

#create matrix with 10 rows and 3 columns
x = matrix(data = sample.int(100, 30), nrow = 10, ncol = 3)

#print matrix
print(x)

#attempt to display 11th row of matrix
x[11, ]

#attempt to display 4th column of matrix
x[, 4]

#attempt to display value in 11th row and 4th column
x[11, 4]

Solution:

#

#display number of rows and columns in matrix
dim(x)

#

#display 10th row of matrix
x[10, ]

#display number of columns in matrix
ncol(x)

#display 3rd column of matrix
x[, 3]

#display value in 10th row and 3rd column of matrix
x[10, 3]

Full error Messages:
>
> #attempt to display 11th row of matrix
> x[11, ]
Error in x[11, ] : subscript out of bounds
>
> #attempt to display 4th column of matrix
> x[, 4]
Error in x[, 4] : subscript out of bounds
>
> #attempt to display value in 11th row and 4th column
> x[11, 4]
Error in x[11, 4] : subscript out of bounds
>

[Solved] R Error: Python module tensorflow.keras was not found.

Scenario:

rstudio reported error R: Python module tensorflow.keras was not found.
at first, I suspected that I could not accurately locate the keras package of R, because I was using Anaconda to do other things, but later I saw other error reports and felt that they were not so complex… Later, I found that they were just simple and not installed properly… In short, the solution is as follows


Solution:

terminal input:

install.packages(tensorflow)
install_tensorflow()
library(tensorflow)
#Keras The R interface uses the TensorFlow backend engine.
# To install the core Keras library and TensorFlow backend, use the install_keras() function
install_keras()
library(keras)
# Run them all and then tune the package, if you have already done so, restart RStudio
-------------------------------------------
#Other solutions to this problem are as follows:
library(tensorflow)
library(keras)
use_condaenv("r-tensorflow")

RCurl error-fatal error: curl/curl.h: No such file or directory

# R version 4.1.1 (2021-08-10)
install.packages("E:/R/R-4.1.1/library/RCurl_1.98-1.4.tar.gz", repos = NULL, type = "source")

The operation process is as follows:

* installing *source* package 'RCurl' ...
** package 'RCurl' successfully unpacked and MD5 sums checked
** using staged installation
** libs

*** arch - i386
"E:/R/rtools40/mingw32/bin/"gcc  -I"E:/R/R-41~1.1/include" -DNDEBUG -I/include -DHAVE_LIBIDN_FIELD=1 -DHAVE_CURLOPT_URL=1 -DHAVE_CURLINFO_EFFECTIVE_URL=1 -DHAVE_CURLINFO_RESPONSE_CODE=1 -DHAVE_CURLINFO_TOTAL_TIME=1 -DHAVE_CURLINFO_NAMELOOKUP_TIME=1 -DHAVE_CURLINFO_CONNECT_TIME=1 -DHAVE_CURLINFO_PRETRANSFER_TIME=1 -DHAVE_CURLINFO_SIZE_UPLOAD=1 -DHAVE_CURLINFO_SIZE_DOWNLOAD=1 -DHAVE_CURLINFO_SPEED_DOWNLOAD=1 -DHAVE_CURLINFO_SPEED_UPLOAD=1 -DHAVE_CURLINFO_HEADER_SIZE=1 -DHAVE_CURLINFO_REQUEST_SIZE=1 -DHAVE_CURLINFO_SSL_VERIFYRESULT=1 -DHAVE_CURLINFO_FILETIME=1 -DHAVE_CURLINFO_CONTENT_LENGTH_DOWNLOAD=1 -DHAVE_CURLINFO_CONTENT_LENGTH_UPLOAD=1 -DHAVE_CURLINFO_STARTTRANSFER_TIME=1 -DHAVE_CURLINFO_CONTENT_TYPE=1 -DHAVE_CURLINFO_REDIRECT_TIME=1 -DHAVE_CURLINFO_REDIRECT_COUNT=1 -DHAVE_CURLINFO_PRIVATE=1 -DHAVE_CURLINFO_HTTP_CONNECTCODE=1 -DHAVE_CURLINFO_HTTPAUTH_AVAIL=1 -DHAVE_CURLINFO_PROXYAUTH_AVAIL=1 -DHAVE_CURLINFO_OS_ERRNO=1 -DHAVE_CURLINFO_NUM_CONNECTS=1 -DHAVE_CURLINFO_SSL_ENGINES=1 -DHAVE_CURLINFO_COOKIELIST=1 -DHAVE_CURLINFO_LASTSOCKET=1 -DHAVE_CURLINFO_FTP_ENTRY_PATH=1 -DHAVE_CURLINFO_REDIRECT_URL=1 -DHAVE_CURLINFO_PRIMARY_IP=1 -DHAVE_CURLINFO_APPCONNECT_TIME=1 -DHAVE_CURLINFO_CERTINFO=1 -DHAVE_CURLINFO_CONDITION_UNMET=1 -DHAVE_CURLOPT_KEYPASSWD=1 -DHAVE_CURLOPT_DIRLISTONLY=1 -DHAVE_CURLOPT_APPEND=1 -DHAVE_CURLOPT_KRBLEVEL=1 -DHAVE_CURLOPT_USE_SSL=1 -DHAVE_CURLOPT_TIMEOUT_MS=1 -DHAVE_CURLOPT_CONNECTTIMEOUT_MS=1 -DHAVE_CURLOPT_HTTP_TRANSFER_DECODING=1 -DHAVE_CURLOPT_HTTP_CONTENT_DECODING=1 -DHAVE_CURLOPT_NEW_FILE_PERMS=1 -DHAVE_CURLOPT_NEW_DIRECTORY_PERMS=1 -DHAVE_CURLOPT_POSTREDIR=1 -DHAVE_CURLOPT_OPENSOCKETFUNCTION=1 -DHAVE_CURLOPT_OPENSOCKETDATA=1 -DHAVE_CURLOPT_COPYPOSTFIELDS=1 -DHAVE_CURLOPT_PROXY_TRANSFER_MODE=1 -DHAVE_CURLOPT_SEEKFUNCTION=1 -DHAVE_CURLOPT_SEEKDATA=1 -DHAVE_CURLOPT_CRLFILE=1 -DHAVE_CURLOPT_ISSUERCERT=1 -DHAVE_CURLOPT_ADDRESS_SCOPE=1 -DHAVE_CURLOPT_CERTINFO=1 -DHAVE_CURLOPT_USERNAME=1 -DHAVE_CURLOPT_PASSWORD=1 -DHAVE_CURLOPT_PROXYUSERNAME=1 -DHAVE_CURLOPT_PROXYPASSWORD=1 -DHAVE_CURLOPT_SSH_HOST_PUBLIC_KEY_MD5=1 -DHAVE_CURLOPT_NOPROXY=1 -DHAVE_CURLOPT_TFTP_BLKSIZE=1 -DHAVE_CURLOPT_SOCKS5_GSSAPI_SERVICE=1 -DHAVE_CURLOPT_SOCKS5_GSSAPI_NEC=1 -DHAVE_CURLOPT_PROTOCOLS=1 -DHAVE_CURLOPT_REDIR_PROTOCOLS=1 -DHAVE_CURLOPT_SSH_AUTH_TYPES=1 -DHAVE_CURLOPT_SSH_PUBLIC_KEYFILE=1 -DHAVE_CURLOPT_SSH_PRIVATE_KEYFILE=1 -DHAVE_CURLOPT_FTP_SSL_CCC=1 -DHAVE_CURLOPT_COOKIELIST=1 -DHAVE_CURLOPT_IGNORE_CONTENT_LENGTH=1 -DHAVE_CURLOPT_FTP_SKIP_PASV_IP=1 -DHAVE_CURLOPT_FTP_FILEMETHOD=1 -DHAVE_CURLOPT_LOCALPORT=1 -DHAVE_CURLOPT_LOCALPORTRANGE=1 -DHAVE_CURLOPT_CONNECT_ONLY=1 -DHAVE_CURLOPT_CONV_FROM_NETWORK_FUNCTION=1 -DHAVE_CURLOPT_CONV_TO_NETWORK_FUNCTION=1 -DHAVE_CURLOPT_CONV_FROM_UTF8_FUNCTION=1 -DHAVE_CURLOPT_MAX_SEND_SPEED_LARGE=1 -DHAVE_CURLOPT_MAX_RECV_SPEED_LARGE=1 -DHAVE_CURLOPT_FTP_ALTERNATIVE_TO_USER=1 -DHAVE_CURLOPT_SOCKOPTFUNCTION=1 -DHAVE_CURLOPT_SOCKOPTDATA=1 -DHAVE_CURLOPT_SSL_SESSIONID_CACHE=1 -DHAVE_CURLOPT_WRITEDATA=1 -DCURL_STATICLIB         -O2 -Wall  -std=gnu99 -mfpmath=sse -msse2 -mstackrealign  -c base64.c -o base64.o
In file included from base64.c:1:
Rcurl.h:4:10: fatal error: curl/curl.h: No such file or directory
 #include <curl/curl.h>
          ^~~~~~~~~~~~~
compilation terminated.
make: *** [E:/R/R-41~1.1/etc/i386/Makeconf:238: base64.o] Error 1
ERROR: compilation failed for package 'RCurl'
* removing 'E:/R/R-4.1.1/library/RCurl'
* restoring previous 'E:/R/R-4.1.1/library/RCurl'
Warning in install.packages :
  installation of package ‘E:/R/R-4.1.1/library/RCurl_1.98-1.4.tar.gz’ had non-zero exit status

Computer R version:

CIBERSOFT $operator is invalid for atomic vectors [How to Solve]

When Cybersoft was run with R for immune infiltration annotation

Error report found

$ operator is invalid for atomic vectors
#and the problem occurs in the source code
weights = t(out[[t]]$coefs) %*% out[[t]]$SV

The search failed for a long time and was finally solved, so I came to make a record

Yes, the package is not installed

R Language Error: variable does not have limits defined by datadist

R language, error reporting

As in nomogram

variable variable name does not have limits defined by datadist 

You need to add the following code after importing data

dd <- datadist(abc)
options(datadist="dd")

abc is your data that imported
For a given set of variables or a data frame, determines summaries of variables for effect and plotting ranges, values to adjust to, and overall ranges for Predict, plot.Predict, ggplot.Predict, summary.rms, survplot, and nomogram.rms. If datadist is called before a model fit and the resulting object pointed to with options(datadist=“name”), the data characteristics will be stored with the fit by Design(), so that later predictions and summaries of the fit will not need to access the original data used in the fit. Alternatively, you can specify the values for each variable in the model when using these 3 functions, or specify the values of some of them and let the functions look up the remainder (of say adjustmemt levels) from an object created by datadist. The best method is probably to run datadist once before any models are fitted, storing the distribution summaries for all potential variables. Adjustment values are 0 for binary variables, the most frequent category (or optionally the first category level) for categorical (factor) variables, the middle level for ordered factor variables, and medians for continuous variables. See descriptions of q.display and q.effect for how display and effect ranges are chosen for continuous variables.