Error in plot.new() : figure margins too large
Full error:
#Question
Fit the regression model and calculate the dfbetas value of each sample and the optimal dfbetas threshold. Finally, visualize the impact of each sample on each predictive variable;
#fit a regression model
model <- lm(mpg~disp+hp, data=mtcars)

#view model summary
summary(model)

#calculate DFBETAS for each observation in the model
dfbetas <- as.data.frame(dfbetas(model))

#display DFBETAS for each observation
dfbetas

#find number of observations
n <- nrow(mtcars)

#calculate DFBETAS threshold value
thresh <- 2/sqrt(n)

thresh

#specify 2 rows and 1 column in plotting region

#dev.off()
#par(mar = c(1, 1, 1, 1))

par(mfrow=c(2,1))

#plot DFBETAS for disp with threshold lines
plot(dfbetas$disp, type='h')
abline(h = thresh, lty = 2)
abline(h = -thresh, lty = 2)

#plot DFBETAS for hp with threshold lines
plot(dfbetas$hp, type='h')
abline(h = thresh, lty = 2)
abline(h = -thresh, lty = 2)
#Solution
par(mar = c(1, 1, 1, 1))
#fit a regression model
model <- lm(mpg~disp+hp, data=mtcars)

#view model summary
summary(model)

#calculate DFBETAS for each observation in the model
dfbetas <- as.data.frame(dfbetas(model))

#display DFBETAS for each observation
dfbetas

#find number of observations
n <- nrow(mtcars)

#calculate DFBETAS threshold value
thresh <- 2/sqrt(n)

thresh

#specify 2 rows and 1 column in plotting region

#dev.off()
par(mar = c(1, 1, 1, 1))

par(mfrow=c(2,1))

#plot DFBETAS for disp with threshold lines
plot(dfbetas$disp, type='h')
abline(h = thresh, lty = 2)
abline(h = -thresh, lty = 2)

#plot DFBETAS for hp with threshold lines
plot(dfbetas$hp, type='h')
abline(h = thresh, lty = 2)
abline(h = -thresh, lty = 2)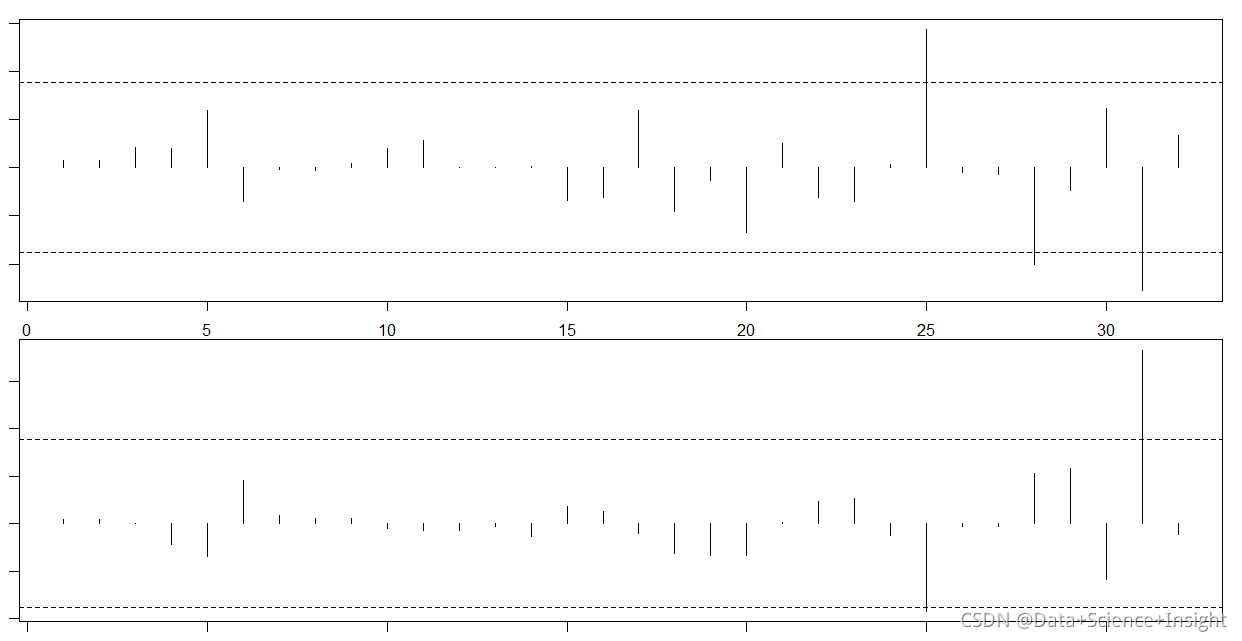
Full Error Message:
> par(mfrow=c(2,1))
>
> #plot DFBETAS for disp with threshold lines
> plot(dfbetas$disp, type=’h’)
Error in plot.new() : figure margins too large
> abline(h = thresh, lty = 2)
Error in int_abline(a = a, b = b, h = h, v = v, untf = untf, …) :
plot.new has not been called yet
> abline(h = -thresh, lty = 2)
Error in int_abline(a = a, b = b, h = h, v = v, untf = untf, …) :
plot.new has not been called yet
>
> #plot DFBETAS for hp with threshold lines
> plot(dfbetas$hp, type=’h’)
Error in plot.new() : figure margins too large
> abline(h = thresh, lty = 2)
Error in int_abline(a = a, b = b, h = h, v = v, untf = untf, …) :
plot.new has not been called yet
> abline(h = -thresh, lty = 2)
Error in int_abline(a = a, b = b, h = h, v = v, untf = untf, …) :
plot.new has not been called yet
Read More:
- [Solved] ES Query SIZE too large Error: ENTITY CONTENT IS TOO LONG [105539255] FOR THE CONFIGURED BUFFER LIMIT [104857600]
- [Solved] ELK Log System Error: “statusCode“:429,“error“:“Too Many Requests“,“message“ Data too large
- [Solved] sqoop Error: jSQLException in nextKeyValue Caused by: ORA-24920:column size too large for client
- Grafana Error: 414 Request-URI Too Large [How to Solve]
- [Solved] nodejs Error: request entity too large
- [Solved] Browser Access Error: Request Header or Cookie too large
- [Solved] Nginx Error: 400 Request Header Or Cookie Too Large
- How to Solve Nginx 413 Error (request entity too large)
- [How to Solve] java.lang.IllegalArgumentException: Request header is too large
- .Net Core 5.0 Upload File limit via Swagger Api report error: error: request entity too large [Three Methods]
- How to Solve Keras calls plot_model error
- C++ new types may not be defined in a return type Error?
- AN ERROR MESSAGE APPEARS WHEN TOMCAT DEPLOYS A NEW PROJECT: INVALID BYTE TAG IN CONSTANT POOL: 15
- [Solved] GBase 8a MPP Database sftp Loading Large File Error
- Vue Uncaught (in promise) Error: Navigation cancelled from “/home“ to “/login“ with a new navigation
- [Solved] throw new Error(“‘output.filename’ is required, either in config file or as –output-filename”);
- [Solved] Doris Error: too many filtered rows
- [Solved] winnt.h a large number of file errors (287): error c2059: syntax error: “;”
- New Spring boot startup error Failed to auto-configure a DataSource
- kubeadm join Add a New Note Error [How to Solve]