Tag Archives: Machine learning

[Solved] Could not find a package configuration file provided by “moveit_core“

Error resolution

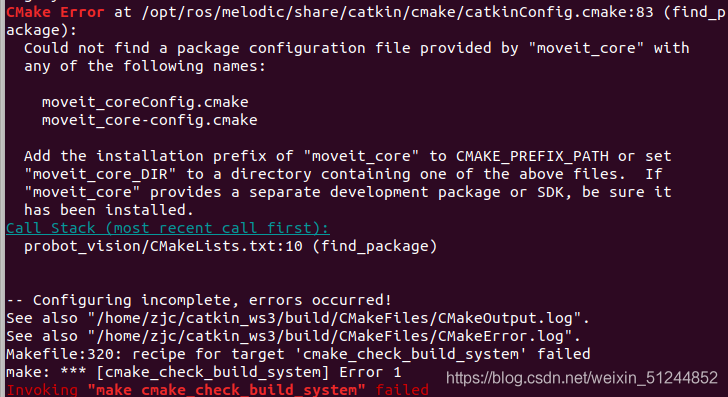
Could not find a package configuration file provided by "moveit_core" with
  any of the following names:

    moveit_coreConfig.cmake
    moveit_core-config.cmake

  Add the installation prefix of "moveit_core" to CMAKE_PREFIX_PATH or set
  "moveit_core_DIR" to a directory containing one of the above files.  If
  "moveit_core" provides a separate development package or SDK, be sure it
  has been installed.

Solution warning: userwarning: fixedformatter should only be used together with fixedlocator (illustrated version)!)

Resolve warning

Error information problem code problem analysis and solution

Error information

• When we draw the edge histogram, the following warning will appear when we use the conventional method to convert the x-axis scale of the scatter plot to floating-point number!!!

UserWarning: FixedFormatter should only be used together with FixedLocator
  ax_main.set_xticklabels(xlabels)

Problem code

xlabels = ax_main.get_xticks().tolist() # Convert scale values to floating point numbers
ax_main.set_xticklabels(xlabels) # Set the scale value to floating point
plt.show()

• When you use the above code to convert the scale value to floating-point number, the same warning as the title will appear, but the x-axis scale of the scatter image displayed has been successfully converted to floating-point number, as shown in the figure below
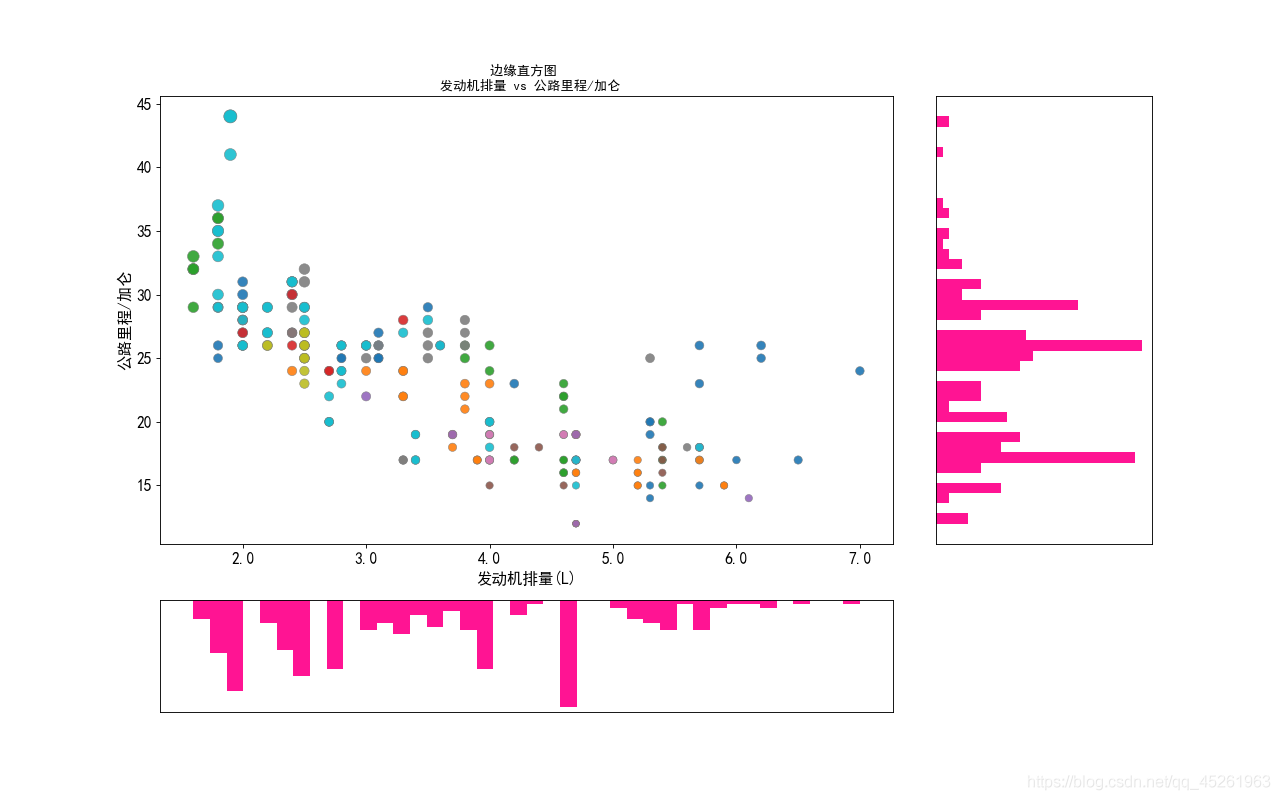
Problem analysis

• Problem Description: This is a user warning: it is a warning caused by our nonstandard operation. It tells us that fixedformatter (scale form) can only be used with fixedlocator , but can’t use other methods to change the scale form!!!

solve the problem

• In the above we analyzed the causes of the warning, we should use the fixedlocator locator to change the fixedformatter (scale form), rather than directly convert the scale format, leading to the warning
• First, import the ticker module in Matplotlib library, and the code is as follows:

import matplotlib.ticker as mticker

label_format = '{:,.1f}'  # Create floating point format .1f one decimal
xlabels = ax_main.get_xticks().tolist()
ax_main.xaxis.set_major_locator(mticker.FixedLocator(xlabels)) # locate to the x-axis of the scatter plot
ax_main.set_xticklabels([label_format.format(x) for x in xlabels]) # Convert scales to floating point numbers using a list derivative loop
plt.show()

Image display:
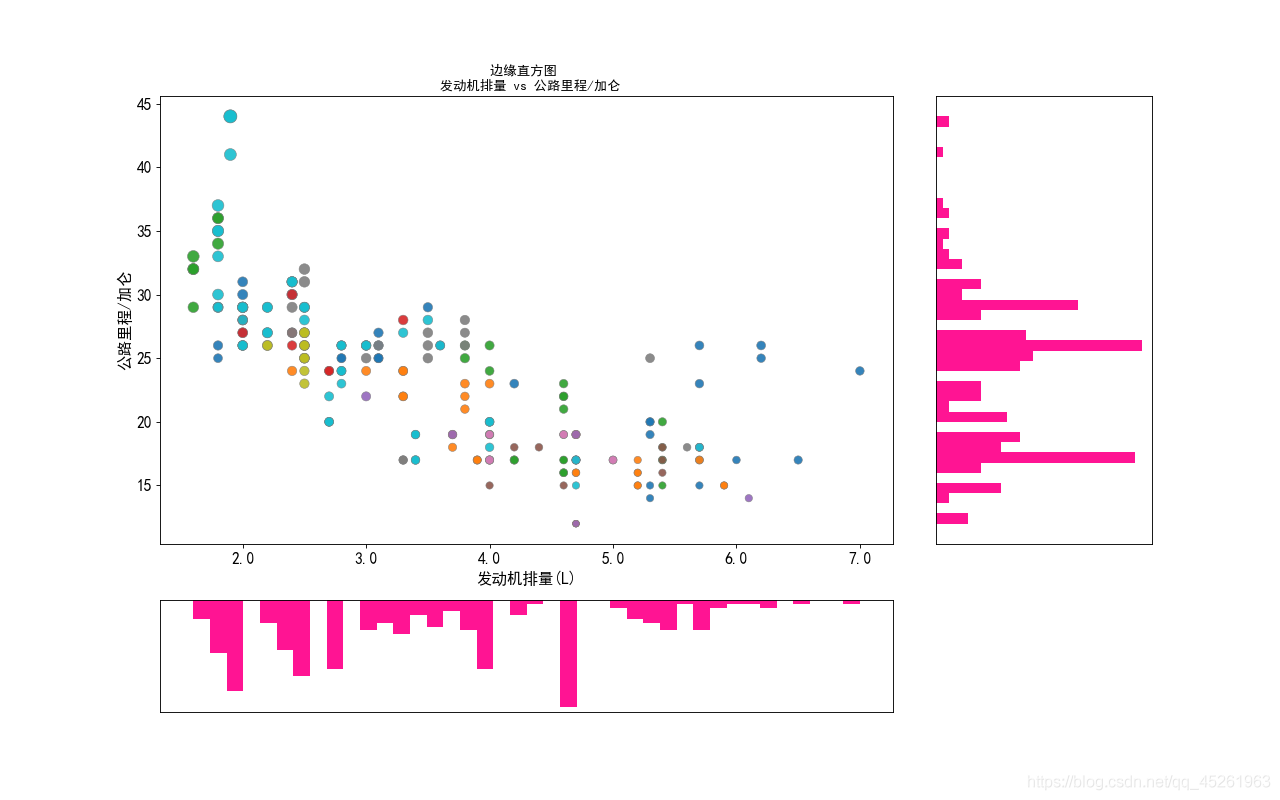
• The complete code for drawing the above image is:

import matplotlib.pyplot as plt
import matplotlib.ticker as mticker
import pandas as pd

# Get the data
df = pd.read_csv(r'D:\9\mpg_ggplot2.csv')

# Create a canvas and split it into a grid
fig = plt.figure(figsize=(16, 10), dpi=80, facecolor='white')
grid = plt.GridSpec(4, 4, hspace=0.5, wspace=0.2)

# Add subgraphs
ax_main = fig.add_subplot(grid[:-1, :-1])
ax_right = fig.add_subplot(grid[:-1, -1], xticklabels=[], yticklabels=[])
ax_bottom = fig.add_subplot(grid[-1, :-1], xticklabels=[], yticklabels=[])

# Plot the bubble in the center

ax_main.scatter('displ', 'hwy'
                , s=df.cty * 4
                , data=df
                , c=df.manufacturer.astype('category').cat.codes
                , cmap='tab10'
                , edgecolors='gray'
                , linewidth=.5
                , alpha=.9)
# Plot the bottom histogram
ax_bottom.hist(df.displ, 40, histtype='stepfilled', orientation='vertical', color='deeppink')
ax_bottom.invert_yaxis() # make the y-axis inverse

# Plot the right histogram
ax_right.hist(df.hwy, 40, histtype='stepfilled', orientation='horizontal', color='deeppink')

# decorate the image
plt.rcParams['font.sans-serif'] = ['Simhei']
ax_main.set(title='Edge histogram \n engine displacement vs highway miles/gallon'
            , xlabel='Engine displacement (L)'
            , ylabel='Highway miles/gallon')
ax_main.title.set_fontsize = (20)

for item in ([ax_main.xaxis.label, ax_main.yaxis.label] + ax_main.get_xticklabels() + ax_main.get_yticklabels()):
    item.set_fontsize(14)

for item in [ax_bottom, ax_right]:
    item.set_xticks([])
    item.set_yticks([])

label_format = '{:,.1f}'  # Create floating point format .1f one decimal
xlabels = ax_main.get_xticks().tolist()
ax_main.xaxis.set_major_locator(mticker.FixedLocator(xlabels)) # locate to the x-axis of the scatter plot
ax_main.set_xticklabels([label_format.format(x) for x in xlabels]) # Convert scales to floating point numbers using a list derivative loop
plt.show()
[Solved] module ‘numpy.random‘ has no attribute ‘default_rng‘ gensim.model

I see that some bloggers have said to upgrade numpy
but my numpy is up-to-date
numpy 1.21.0
but still can’t
to get to the point directly
* * my solution may be limited to gensim *
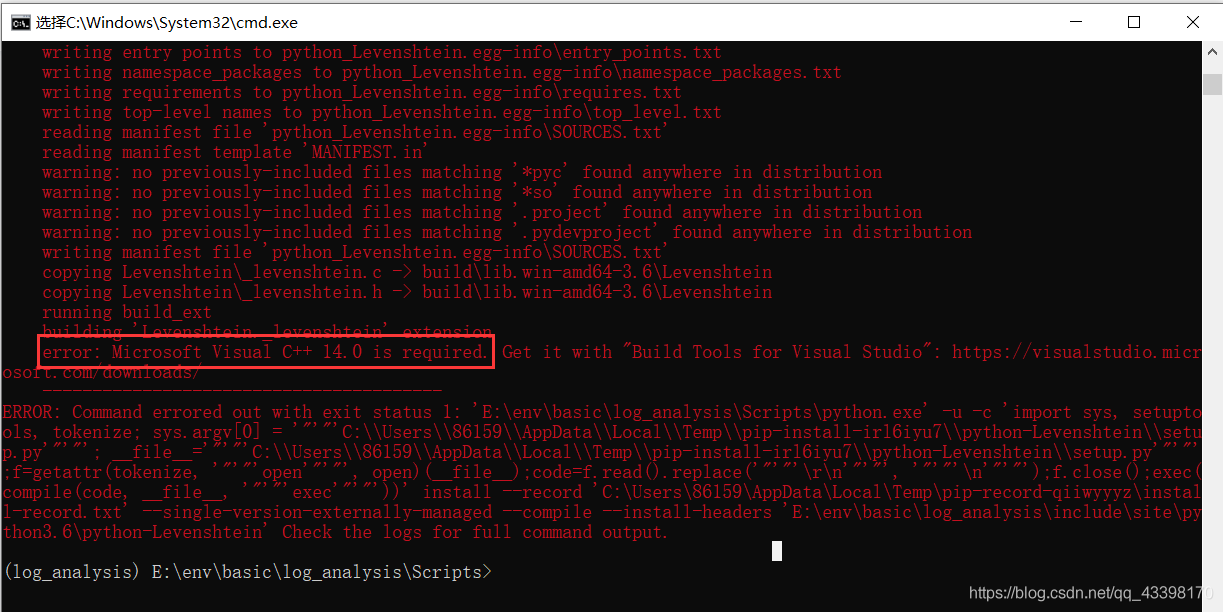
(1) in Python, from gensim.models import fasttext shows that a file is disabled, PIP install Python Levenshtein can solve the problem, However, the following errors occurred during the installation process, which means that visual c + + 14.0 is missing or upgraded.

(2) in order to avoid this problem, install the WHL file directly and download it according to your own Python version. After 64 bit and 34 bit
PIP install path + WHL file, you can successfully install

(3) Restart Jupiter notebook
must restart, I don’t know why, restart not report error
solution

[Solved] Raspberry Pi Error: AttributeError: module ‘serial‘ has no attribute ‘Serial‘

Solution: you only need to install pyserial instead of serial. If serial has been installed, you can uninstall it.
—————————————————-
solution: open pychar on your computer and find that it can run. PIP list shows that only pyserial is installed, After importing serial, click in to see the specific method. It is found that the init.py of the serial on the computer is different from that on the raspberry pie
the raspberry pie on the computer is basically empty. You can run it after uninstalling the serial discovery program
I don’t know why all bloggers on Baidu search need to install serial and pyserial

The attribute error: he has no attributes.

Error: NoneType ‘object has no attribute ‘seconds’

Time-famifamifamifamitime _operationon/date date date
import date
import date date
import date date
start time = datetime.date.time.now(()
> endtime = datetime.date.date.now(()
> endtime = date.date.date.now(),
print (endtime-starttime). seconds
print(endtime-starttime). seconds
> change after changes:
import date
date
import date
date> starttime
starttime = date date date date.date.time.now()
s
print(a)

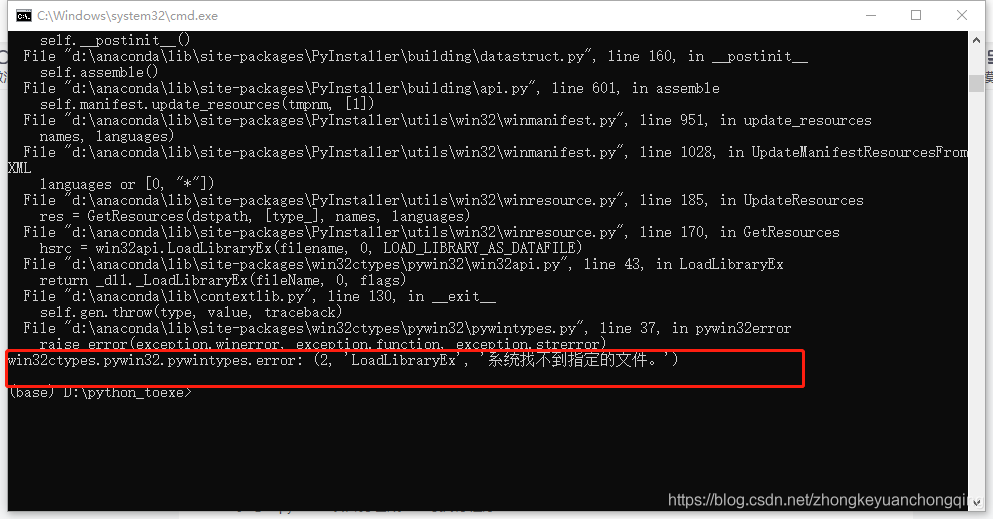
Win32ctypes. Pywin32. Pywintypes. Error: (2 ‘loadlibraryex’,’the system can’t find the specified file. ‘)

Win32ctypes. Pywin32. Pywintypes. Error: (2 ‘loadlibraryex’,’the system can’t find the specified file. ‘)

catalogue

Win32ctypes. Pywin32. Pywintypes. Error: (2 ‘loadlibraryex’,’the system can’t find the specified file. ‘)

Questions

Solution


Questions

Using pyinstaller to package py file as windows exe program, the following problems are encountered:

Win32ctypes. Pywin32. Pywintypes. Error: (2, ‘loadlibraryex’,’the system can’t find the specified file. ‘)

Stack overflow and CSDN, you can see all kinds of things

Some say that virtual environment must be used, but I don’t believe it;

Some people say that you must use native Python environment (not Anaconda or other integrated environment), but I don’t believe it;

Some people say that it may be caused by the too low and too high version of Python;

Some people say that maybe your version of pyinstaler is too high. Let’s have a try. I believe it;

#The following error occurred

Win32ctypes. Pywin32. Pywintypes. Error: (2, ‘loadlibraryex’,’the system can’t find the specified file. ‘)

#It is suspected that the temporary file in the original build interferes with the new build. After deleting the temporary file, it continues to build, and the same error still exists;

Solution

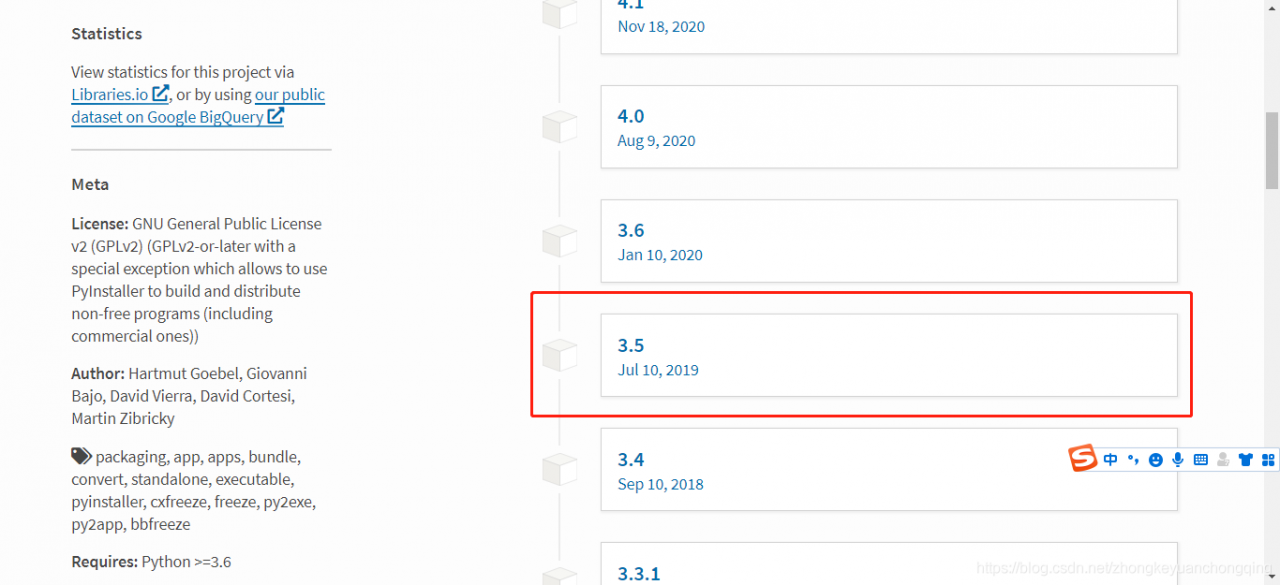
#Check on stack overflow and CSDN. There are all kinds of things to say. Finally, we adopted the method of reducing the version and succeeded

#   pip install pyinstaller==3.5

#   pyinstaller -F prediction.py

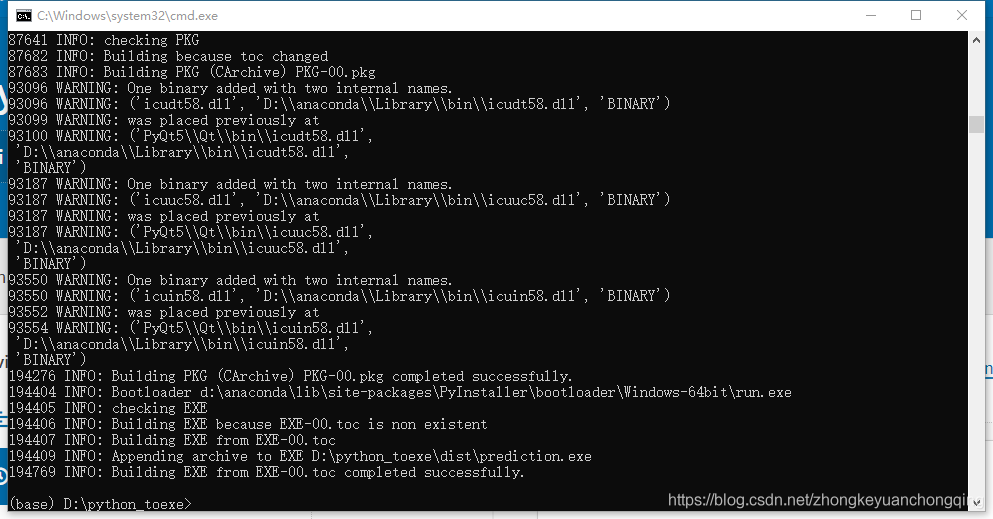
#The file structure after packaging is as follows:

#The prediction.exe file generated by the package is stored in the dist directory

Reference: pythoninstaller

Reference: packaging with pyinstaler failed. Error: win32ctypes. Pywin32. Pywintypes. Error: (1920, ‘loadlibraryexw’,’the system cannot access this file. ‘)

Reference: pitfalls encountered by Python pyinstall packaging tool

Reference: pyinstaller win32ctypes. Pywin32. Pywintypes. Error: (2, ‘loadlibraryexw’,’the system cannot find the file specified. ‘)

Reference: pyinnstaller win32ctypes. Pywin32. Pywintypes. Error: (1920, ‘loadlibraryexw’,’system cannot access the file ‘)

RuntimeError: implement_array_function method already has a docstring(Pycharm install package error)

Recently, I’m writing the course of financial analysis and prediction in Python. Because I’m lazy, I didn’t match the required Library under CONDA in advance. Using pychar install package directly will lead to some version incompatibility and mismatching due to the installation sequence, which leads to
runtimeerror: implementation_ array_ Function method already has a docstring
error report
mark
I don’t know what I’m writing<
PIP universal pandas
PIP universal mattlotlib
PIP universal Skippy
PIP universal numpy
PIP universal scikit learn
then install
PIP install numpy
PIP install Skippy
PIP install panda
PIP install mattlotlib
pip install scikit learn
in the following order

[Solved] RuntimeError: cuda runtime error: device-side assert trigger

In this way, when running fastercnn, we need to change the original model’s 21 categories to our own number of categories. After the first modification, no error will be reported in the run, and after the second modification, an error will be reported as follows:
1 block: [0,0,0], thread: [16,0,0] assertion T & gt= 0 && amp; t < n_ Classes failed.
2 runtime error: CUDA runtime error (59): device side assert triggered
the main solutions on the Internet are as follows:

The reason for this problem is that there are tags in the training data that exceed the number of categories. For example, I set up a total of 8 classes, but if 9 appears in the tag in the training data, this error will be reported. So here’s the problem. There’s a trap. If the tag in the training data contains 0, the above error will also be reported. This is very weird. Generally, we start counting from 0, but in Python, the category labels below 0 have to report an error. So if the category label starts from 0, add 1 to all category labels.

Solution:
The first time I ran the program, I found that there were 16 categories (I deleted 4 categories, but I didn’t find them). After running the program, I found that there were four more categories, so I deleted these four categories. However, when I ran the program again, I reported the above error. The reason is that every time we
run the program, we have to delete the cache generated by the last run, because I didn’t delete it, so the program thought it was 16 categories, But only 12 categories are provided. So if you report this error, you can delete the cache and run it again

[Solved] when using jupyter notebook, “terminated worker error” appears

Error:
When calling pandas_profiling.ProfileReport(df) using Jupyter Notebook, an error is reported “A worker process managed by the executor was unexpectedly terminated. This could be caused by a segmentation fault while calling the function or by an excessive memory usage causing the Operating System to kill the worker.”The solution is as follows.
    Terminal type pip list , view joblib-0.13.2 type pip uninstall joblib type pip install -U joblib

Restart the kernel, then execute the code again and it runs successfully!

Facenet validate_on_lfw.py Error AssertionError: The number of LFW images must be an integer multip

When collecting Asian faces for model validation, run the following code:

python validate_on_lfw.py ../data/AsiaStar_160 ../20180402-114759 --lfw_pairs ../data/pairs_AsiaStar.txt

The error is as follows:

AssertionError: The number of LFW images must be an integer multiple of the LFW batch size

The number of pictures must be an integral multiple of the batch size. Batch size is 100, so the number of pictures must be an integral multiple of 100. In generating pairs. TXT, there must be 100 times of sample pairs.

Error in machine learning training data (FIT): valuee rror:Unknown label type:‘continuous‘

I haven’t found the right solution on the Internet, including CSDN. They are all converted to int or multiplied by a number, but actually for the regression task, the label of floating-point number can’t be changed, which will greatly affect the error. My solution is to convert to int first, and then to floating point first

Specifically, for example, y. astype (int). Astype (float)