Resolve warning
Error information problem code problem analysis and solution
Error information
• When we draw the edge histogram, the following warning will appear when we use the conventional method to convert the x-axis scale of the scatter plot to floating-point number!!!
UserWarning: FixedFormatter should only be used together with FixedLocator
  ax_main.set_xticklabels(xlabels)

Problem code
xlabels = ax_main.get_xticks().tolist() # Convert scale values to floating point numbers
ax_main.set_xticklabels(xlabels) # Set the scale value to floating point
plt.show()
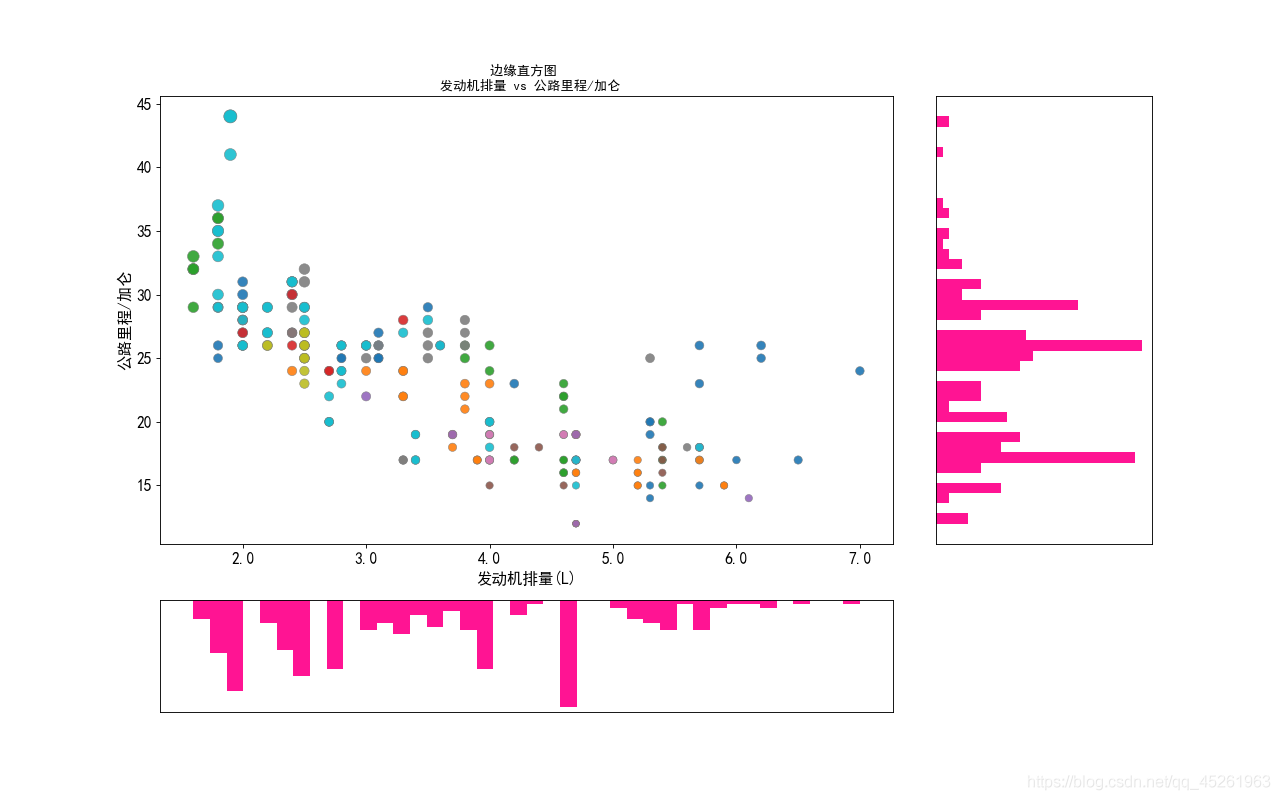
• When you use the above code to convert the scale value to floating-point number, the same warning as the title will appear, but the x-axis scale of the scatter image displayed has been successfully converted to floating-point number, as shown in the figure below
Problem analysis
• Problem Description: This is a user warning: it is a warning caused by our nonstandard operation. It tells us that fixedformatter (scale form) can only be used with fixedlocator , but can’t use other methods to change the scale form!!!
solve the problem
• In the above we analyzed the causes of the warning, we should use the fixedlocator locator to change the fixedformatter (scale form), rather than directly convert the scale format, leading to the warning
• First, import the ticker module in Matplotlib library, and the code is as follows:
import matplotlib.ticker as mticker

label_format = '{:,.1f}'  # Create floating point format .1f one decimal
xlabels = ax_main.get_xticks().tolist()
ax_main.xaxis.set_major_locator(mticker.FixedLocator(xlabels)) # locate to the x-axis of the scatter plot
ax_main.set_xticklabels([label_format.format(x) for x in xlabels]) # Convert scales to floating point numbers using a list derivative loop
plt.show()
Image display:

• The complete code for drawing the above image is:
import matplotlib.pyplot as plt
import matplotlib.ticker as mticker
import pandas as pd

# Get the data
df = pd.read_csv(r'D:\9\mpg_ggplot2.csv')

# Create a canvas and split it into a grid
fig = plt.figure(figsize=(16, 10), dpi=80, facecolor='white')
grid = plt.GridSpec(4, 4, hspace=0.5, wspace=0.2)

# Add subgraphs
ax_main = fig.add_subplot(grid[:-1, :-1])
ax_right = fig.add_subplot(grid[:-1, -1], xticklabels=[], yticklabels=[])
ax_bottom = fig.add_subplot(grid[-1, :-1], xticklabels=[], yticklabels=[])

# Plot the bubble in the center

ax_main.scatter('displ', 'hwy'
                , s=df.cty * 4
                , data=df
                , c=df.manufacturer.astype('category').cat.codes
                , cmap='tab10'
                , edgecolors='gray'
                , linewidth=.5
                , alpha=.9)
# Plot the bottom histogram
ax_bottom.hist(df.displ, 40, histtype='stepfilled', orientation='vertical', color='deeppink')
ax_bottom.invert_yaxis() # make the y-axis inverse

# Plot the right histogram
ax_right.hist(df.hwy, 40, histtype='stepfilled', orientation='horizontal', color='deeppink')

# decorate the image
plt.rcParams['font.sans-serif'] = ['Simhei']
ax_main.set(title='Edge histogram \n engine displacement vs highway miles/gallon'
            , xlabel='Engine displacement (L)'
            , ylabel='Highway miles/gallon')
ax_main.title.set_fontsize = (20)

for item in ([ax_main.xaxis.label, ax_main.yaxis.label] + ax_main.get_xticklabels() + ax_main.get_yticklabels()):
    item.set_fontsize(14)

for item in [ax_bottom, ax_right]:
    item.set_xticks([])
    item.set_yticks([])

label_format = '{:,.1f}'  # Create floating point format .1f one decimal
xlabels = ax_main.get_xticks().tolist()
ax_main.xaxis.set_major_locator(mticker.FixedLocator(xlabels)) # locate to the x-axis of the scatter plot
ax_main.set_xticklabels([label_format.format(x) for x in xlabels]) # Convert scales to floating point numbers using a list derivative loop
plt.show()