Tag Archives: resolvent

[Solved] error: when using the property decorator in Python, an error occurs: typeerror: descriptor ‘setter’ requires a ‘property’ object but

Error message

• When we use the property decorator, the following errors may be caused by the wrong writing of the decorator Name:

TypeError: descriptor 'setter' requires a 'property' object but received a 'function'

Problem analysis

• The reason for this error is that we write all decorator names as property instead of the same method name in our class:

Problem code

class AgeDemo(object):

    def __init__(self, age):
        self.age = age

    @property
    def age_test(self):
        return self.age

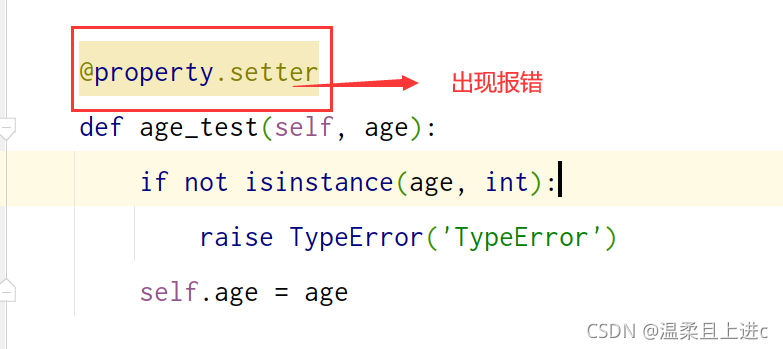
    @property.setter   # error
    def age_test(self, age):
        if not isinstance(age, int):
            raise TypeError('TypeError')
        self.age = age

Resolve error reporting

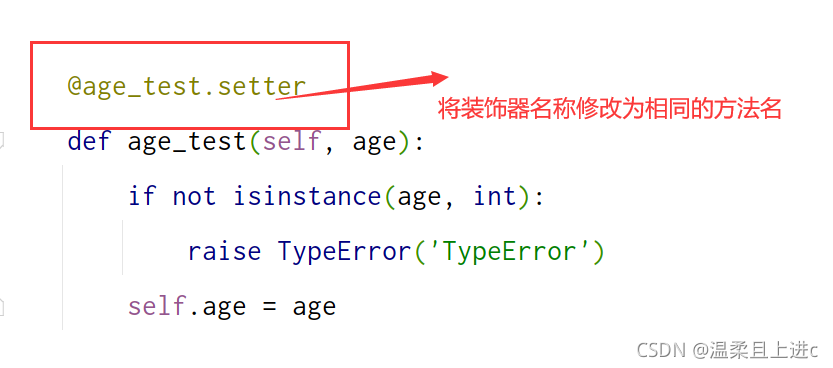
• Change the name of the decorator with an error in the figure to the same name set in our class to solve this error
the code is as follows:

class AgeDemo(object):

    def __init__(self, age):
        self.age = age

    @property
    def age_test(self):
        return self.age

    @age_test.setter # 修改的代码行
    def age_test(self, age):
        if not isinstance(age, int):
            raise TypeError('TypeError')
        self.age = age

[Solved] Docker+uWSGI+Flask Error: ModuleNotFoundError: No module named ‘flask‘

Background

The docker + nginx + uwsgi + flask deployment environment has always been able to run well before. This time, the Python version of the basic image was upgraded from the original 3.6 to 3.8 , and the title was wrong.

docker + nginx + uwsgi + flask deployment can refer to this article

Problem analysis

Let’s take a look at the start log of docker:

Starting nginx: nginx.,
*** Starting uWSGI 2.0.18-debian (64bit) on [Tue Aug 17 02:21:46 2021] ***,
[uWSGI] getting INI configuration from uwsgi.ini,
compiled with version: 8.2.0 on 10 February 2019 02:42:46,
os: Linux-3.10.0-957.el7.x86_64 #1 SMP Thu Nov 8 23:39:32 UTC 2018,
nodename: 9c8cc3ffd4ed,
machine: x86_64,
pcre jit disabled,
detected number of CPU cores: 2,
clock source: unix,
current working directory: /code,
detected binary path: /usr/bin/uwsgi-core,
uWSGI running as root, you can use --uid/--gid/--chroot options,
chdir() to /code,
*** WARNING: you are running uWSGI as root !!! (use the --uid flag) *** ,
*** WARNING: you are running uWSGI without its master process manager ***,
your memory page size is 4096 bytes,
detected max file descriptor number: 1048576,
lock engine: pthread robust mutexes,
thunder lock: disabled (you can enable it with --thunder-lock),
uwsgi socket 0 bound to TCP address :5000 fd 3,
uWSGI running as root, you can use --uid/--gid/--chroot options,
*** WARNING: you are running uWSGI as root !!! (use the --uid flag) *** ,
Python version: 3.7.3 (default, Jan 22 2021, 20:04:44)  [GCC 8.3.0],
Python main interpreter initialized at 0x55fa4f5a8990,
uWSGI running as root, you can use --uid/--gid/--chroot options,
*** WARNING: you are running uWSGI as root !!! (use the --uid flag) *** ,
python threads support enabled,
your server socket listen backlog is limited to 100 connections,
your mercy for graceful operations on workers is 60 seconds,
mapped 825016 bytes (805 KB) for 8 cores,
*** Operational MODE: preforking+threaded ***,
Traceback (most recent call last):,
  File "run.py", line 20, in <module>,
    from server import create_app,
  File "./server/__init__.py", line 14, in <module>,
    from flask import Flask,
unable to load app 0 (mountpoint='') (callable not found or import error),
*** no app loaded. going in full dynamic mode ***,
uWSGI running as root, you can use --uid/--gid/--chroot options,
*** WARNING: you are running uWSGI as root !!! (use the --uid flag) *** ,
*** uWSGI is running in multiple interpreter mode ***,
spawned uWSGI worker 1 (pid: 21, cores: 2),
spawned uWSGI worker 2 (pid: 22, cores: 2),
spawned uWSGI worker 3 (pid: 23, cores: 2),
spawned uWSGI worker 4 (pid: 24, cores: 2)

It can be seen from this that an error is reported when quoting flash .

What causes this problem?

If the program does not find the python Library (flash) when running, it will report an error.

Here, we don’t care why he didn’t find it. Since he didn’t find it, we’ll take the initiative to tell him where to find it.

Solution

Modify uwsgi. Ini , and set the value of Python path to /usr/local/lib/Python 3.8/site packages/.

The content of the modified uwsgi. Ini file is:

[uwsgi]
chdir = /code
socket = :5000
pythonpath = /usr/local/lib/python3.8/site-packages/
wsgi-file = run.py
callable = app
chmod-socket = 666
plugins = python3
buffer-size = 65535
processes = 4
threads = 2

All right, problem solved.

Solution warning: userwarning: fixedformatter should only be used together with fixedlocator (illustrated version)!)

Resolve warning

Error information problem code problem analysis and solution

Error information

• When we draw the edge histogram, the following warning will appear when we use the conventional method to convert the x-axis scale of the scatter plot to floating-point number!!!

UserWarning: FixedFormatter should only be used together with FixedLocator
  ax_main.set_xticklabels(xlabels)

Problem code

xlabels = ax_main.get_xticks().tolist() # Convert scale values to floating point numbers
ax_main.set_xticklabels(xlabels) # Set the scale value to floating point
plt.show()

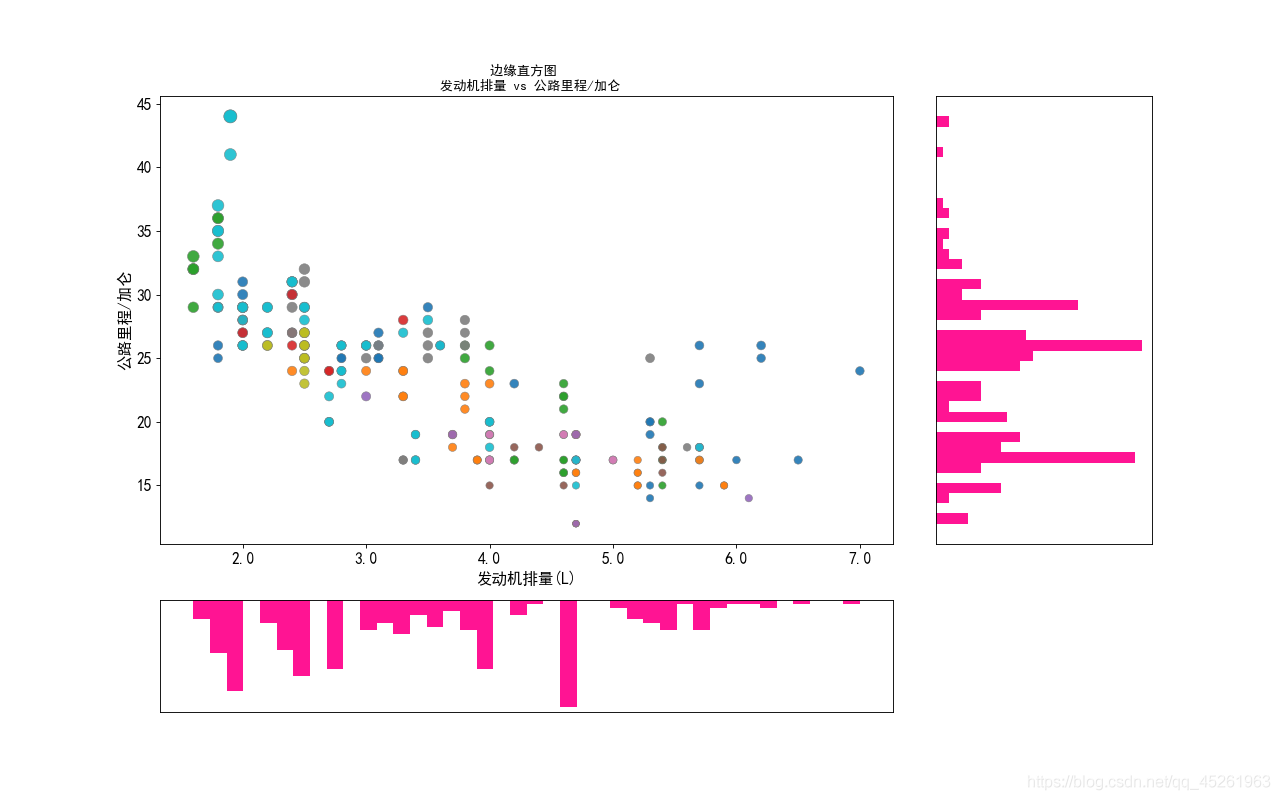
• When you use the above code to convert the scale value to floating-point number, the same warning as the title will appear, but the x-axis scale of the scatter image displayed has been successfully converted to floating-point number, as shown in the figure below

Problem analysis

• Problem Description: This is a user warning: it is a warning caused by our nonstandard operation. It tells us that fixedformatter (scale form) can only be used with fixedlocator , but can’t use other methods to change the scale form!!!

solve the problem

• In the above we analyzed the causes of the warning, we should use the fixedlocator locator to change the fixedformatter (scale form), rather than directly convert the scale format, leading to the warning
• First, import the ticker module in Matplotlib library, and the code is as follows:

import matplotlib.ticker as mticker

label_format = '{:,.1f}'  # Create floating point format .1f one decimal
xlabels = ax_main.get_xticks().tolist()
ax_main.xaxis.set_major_locator(mticker.FixedLocator(xlabels)) # locate to the x-axis of the scatter plot
ax_main.set_xticklabels([label_format.format(x) for x in xlabels]) # Convert scales to floating point numbers using a list derivative loop
plt.show()

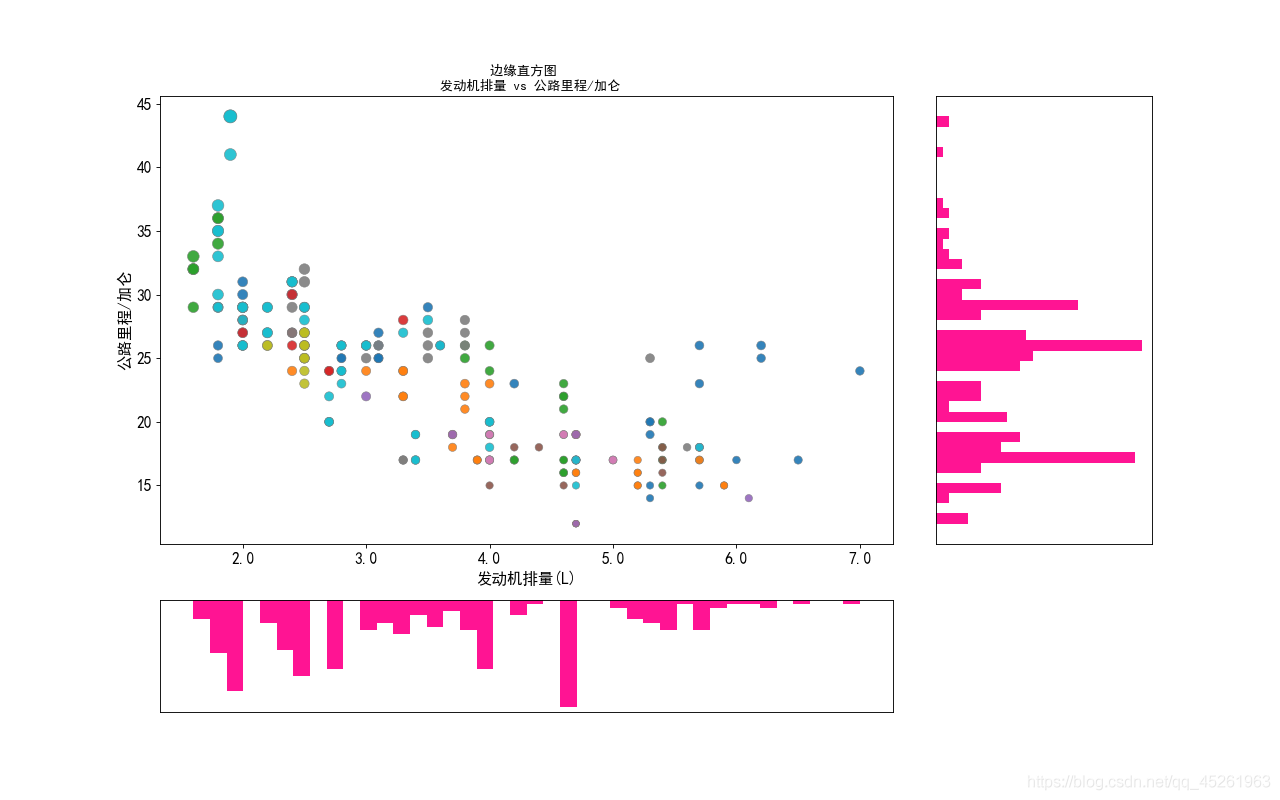
Image display:

• The complete code for drawing the above image is:

import matplotlib.pyplot as plt
import matplotlib.ticker as mticker
import pandas as pd

# Get the data
df = pd.read_csv(r'D:\9\mpg_ggplot2.csv')

# Create a canvas and split it into a grid
fig = plt.figure(figsize=(16, 10), dpi=80, facecolor='white')
grid = plt.GridSpec(4, 4, hspace=0.5, wspace=0.2)

# Add subgraphs
ax_main = fig.add_subplot(grid[:-1, :-1])
ax_right = fig.add_subplot(grid[:-1, -1], xticklabels=[], yticklabels=[])
ax_bottom = fig.add_subplot(grid[-1, :-1], xticklabels=[], yticklabels=[])

# Plot the bubble in the center

ax_main.scatter('displ', 'hwy'
                , s=df.cty * 4
                , data=df
                , c=df.manufacturer.astype('category').cat.codes
                , cmap='tab10'
                , edgecolors='gray'
                , linewidth=.5
                , alpha=.9)
# Plot the bottom histogram
ax_bottom.hist(df.displ, 40, histtype='stepfilled', orientation='vertical', color='deeppink')
ax_bottom.invert_yaxis() # make the y-axis inverse

# Plot the right histogram
ax_right.hist(df.hwy, 40, histtype='stepfilled', orientation='horizontal', color='deeppink')

# decorate the image
plt.rcParams['font.sans-serif'] = ['Simhei']
ax_main.set(title='Edge histogram \n engine displacement vs highway miles/gallon'
            , xlabel='Engine displacement (L)'
            , ylabel='Highway miles/gallon')
ax_main.title.set_fontsize = (20)

for item in ([ax_main.xaxis.label, ax_main.yaxis.label] + ax_main.get_xticklabels() + ax_main.get_yticklabels()):
    item.set_fontsize(14)

for item in [ax_bottom, ax_right]:
    item.set_xticks([])
    item.set_yticks([])

label_format = '{:,.1f}'  # Create floating point format .1f one decimal
xlabels = ax_main.get_xticks().tolist()
ax_main.xaxis.set_major_locator(mticker.FixedLocator(xlabels)) # locate to the x-axis of the scatter plot
ax_main.set_xticklabels([label_format.format(x) for x in xlabels]) # Convert scales to floating point numbers using a list derivative loop
plt.show()

[solution] original error: Chrome not realizable

background

Use appium to do something.

Error report after running:

An unknown server-side error occurred while processing the command. Original error: chrome not reachable

problem analysis

My control script should be no problem, running well on my own computer, so it must be a problem of environment.

From the following aspects:

1、Chrome Driver
2、ADB
3、Appium Desired Capabilities

First, analyze chrome driver to see if it matches the target chrome version on your phone.

Let’s see if the ADB version is the latest or matches your mobile system version.

The problem I have here is that the version of ADB is too low to work properly.

Next, let’s see if several key attributes in desired capabilities match the mobile phone you want to operate. Focus on the following:

platformNameplatformVersionautomationName

resolvent

After the above analysis, the solution is natural.

For my problems, update ADB.

Run again to solve the problem.

Here is just to provide you with an idea, you can choose flexibly according to your own situation.

Attached: reference materials

Appium official document: http://appium.io/docs/en/writing-running-appium/caps/Github Issue: https://github.com/appium/appium/issues/10129