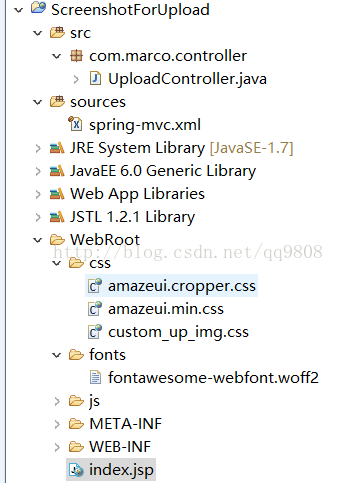
as shown in the figure:
:
solution 1 : the service is started under the root account, turn off the service, kill the process, and then log in with a normal user to restart the service!
solution 2 : find run-debug Configurations -remote Java Application find the corresponding project under connect’s tag set port to 8000 (which means invalid in my case)
If
still doesn’t work, delete all WebViewHistory under Remote Java Application. Instead of creating a new one, Debug it and Eclipse will automatically create a default WebViewHistory for you. Do not debug directly! Close test)
solution 3 : it is possible that there is a firewall problem (close the firewall, this problem still exists!
solution 4 : because it was possible before, so puzzled, Google for a long time, can find the problem is generally because the other side did not open the remote debugging port, so naturally not connected, but I here obviously is not the case. After a long period of confusion, it occurred to me that I might be affected by the Eclipse proxy Settings. It seems unlikely, though, because my understanding is that the agent is only for Eclipse itself, not for applications launched through Eclipse.
solution 5 : this is because Tomcat has not started yet, or it is not started in Debug mode. (of course I don’t have this problem here)
solution 6 : other people in the same group own the connection (only one connection can be used for remote debugging), click the disconnect button. (I still don’t have that problem here)
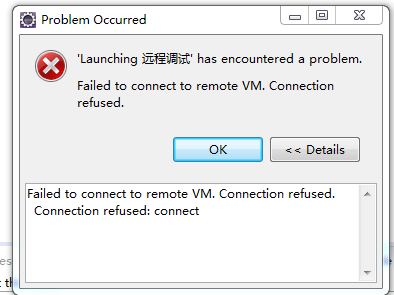
: it’s important to run the application and connect to it, otherwise Eclipse will throw an exception “Failed to connect to remote vm.connection 40”. In the JVM DEBUG parameter, there is a parameter called “suspend” that takes two values, “y” or “n”, and if you want to DEBUG from the beginning, set it to “suspend=y” so that Eclipse can connect to Java applications remotely.
if you want to run the project first and then connect to Eclipse, you can set the parameter to “suspend=n” so that the Java application will be up and running, after which Eclipse will start the remote connection. Tip 2: use the startup script to enter JVM debugging parameters, and use the variable isDebugEnabled or REMOTE_DEBUG_PORT in the script, which you can export when you want to remotely debug Java applications. The entire operation is very simple, requiring only a one-time installation.
prompt 3: if you get an error message, “Failed to connect to remote vm.connection union” or “Connection union: connect”, there are two possible reasons for this. The first is that your Java project is not running on the remote host. The second is that there are errors in the input port and host name. After successful verification, you can fill in the complete host name. Tip 4: you also want to make sure that local Eclipse and remote Eclipse run the same code base. Code can be compiled using the debug option “-g”, and Eclipse can easily collect debugging information, such as debugging information for local variables. By default, with the debug option “-g”, the class file may have larger debug information.
.
solution 8 : find the tomcat/bin/catalina.bat file, edit, and add the downstream code
before CATALINA_OPTS
set CATALINA_OPTS=-server – xdebug-xnoager-djava.com piler= none-xrunjdwp :transport=dt_socket,server=y,suspend=n,address=50001 [port number used for debugging]
save and restart Tomcat (this one doesn’t solve my problem either)
solution 9 : the most likely reason is that the IP address in Eclipse is misconfigured (for this reason, copying the IP address is wrong, so am I…)
solution 10 :
estimated that the network is unstable, but finally the debugging was successful. this… )
solution 11 : firewall issues. Turn off the web firewall in 360 and you’re good to go. I reload every time. This time the reason has finally been found.
.
conclusion : in the future, you must look at the most basic configuration, and then step by step to determine whether your conclusion is correct. In fact, IP address error, this problem should be the first reason to rule out, but I for some reason, did not check, so that I wasted a day’s time!
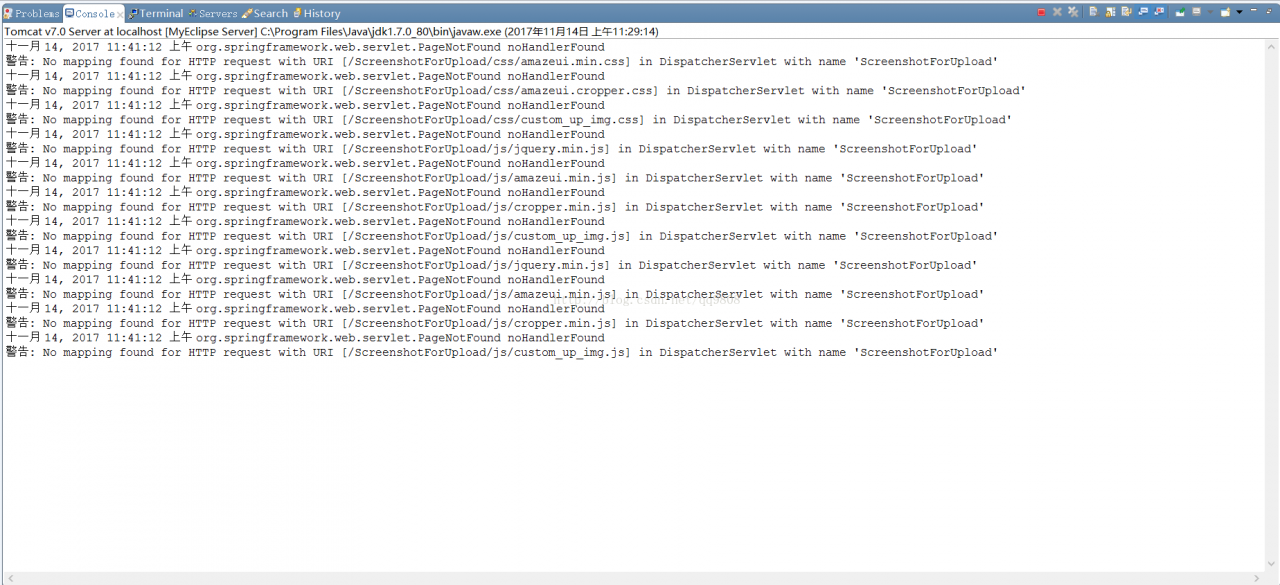
 directly Ctrl+F5 start. The effect is as follows:


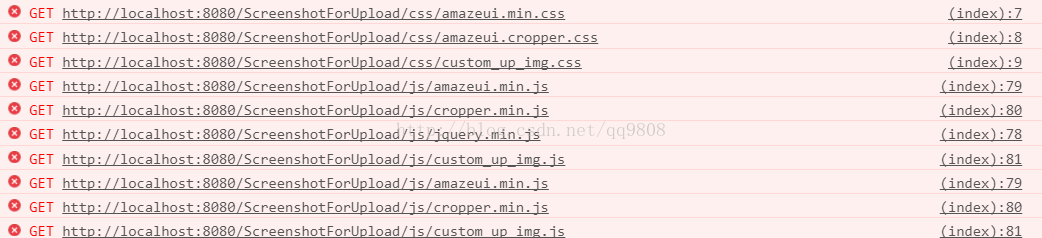
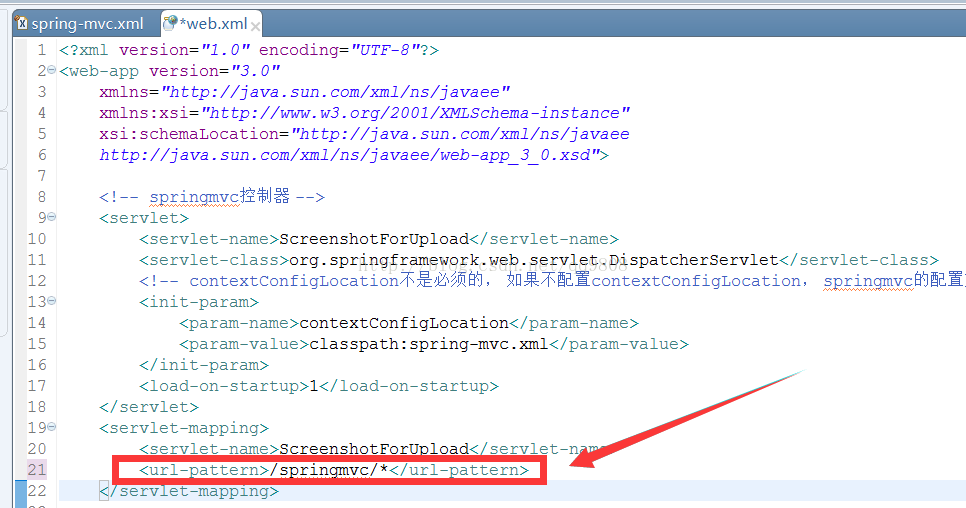 thus distinguishes “requests to Spring MVC” from “requests to static resource files”, but has the disadvantage that all your MVC requests must start with “/ SpringMVC “.