sharpen the knife not by mistake woodcutters, good tools will let us debug a lot of convenience and fast.
in November 2019, Google Chrome 78 release. Js (which may have been available in earlier versions, but I didn’t)
The
entry is next to the familiar “element selection tool” and “device emulator” in the developer tools:

is also easy to use. Click the button, devtools-node. js will pop up, as shown in the figure below:
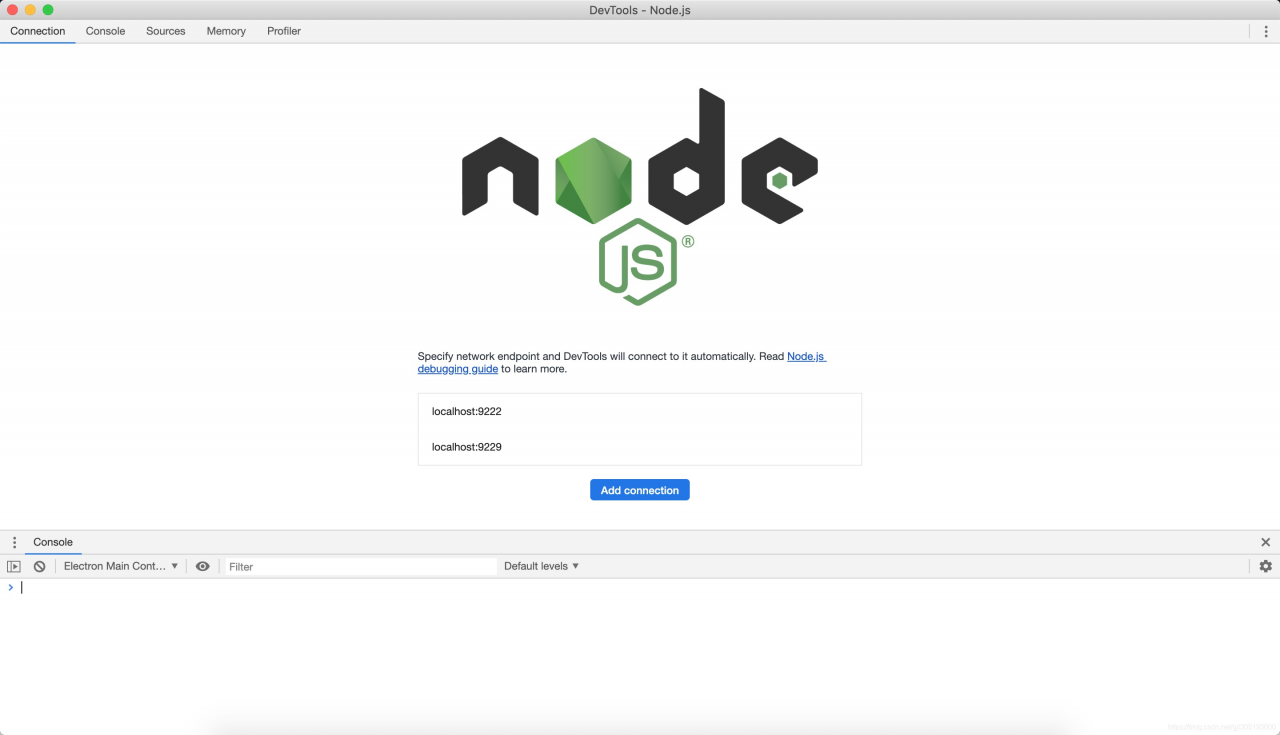
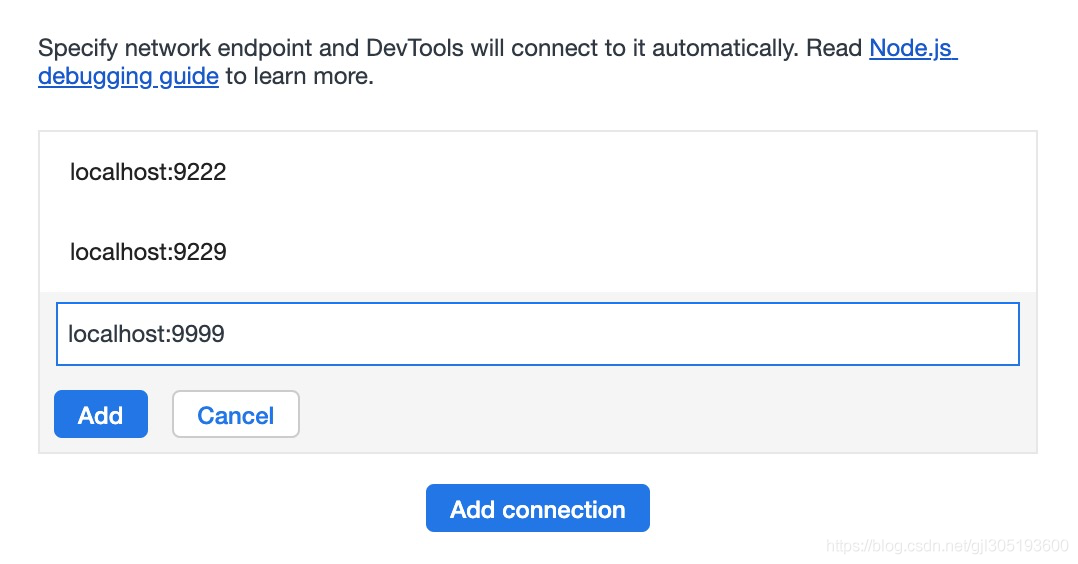
can Add connection by Add connection button, and create a new port listening, here I Add localhost:9999 (as shown below). You can also modify and delete existing links.

everything is ready to start debugging. debugger where you need to debug in NodeJs code. Then execute the command node --inspect=port your_script, for example:
node --inspect=9999 message_list
if we run into an error like , inspector on 127.0.0.1:9229 failed: address already in use try changing the port number.
all normal will automatically enter debugging mode: