we know that pytorch itself comes with a data visualization tool, but when I used the visualization tool, I found that when I trained to use it, it would suddenly get stuck. It turned out that Pytorch incorporated the Tensorboard feature, and I read some blogs that said it was very easy to implement, so It took me some time to research and implement the change, so I Shared it again.
1. Configure the environment:
since we used pytorch to train the model before, tensorflow has never been installed, but if we use tensorboard, it will report an error if only tensorboard is installed. Also, note that the version to be installed should be at least version 1.14.
conda install tensorflow==1.14 will install the tensorboard
2. Tensorboard programming
from torch.utils.tensorboard import SummaryWriter
writer = SummaryWriter()
writer add_scalar(‘ Loss/train ‘, train_loss.avg, epoch)
writer.add_scalar(‘ lr ‘, lr, (‘ images’, grid, epoch)
grid = vutils.make_grid(image)
self.write.add_image (‘ images’, grid, epoch)
3. Visualize
, if done correctly, will generate a run folder under the current folder, which contains a file with many English letters.
at this point you in the terminal input tensorboard – logdir = runs will be
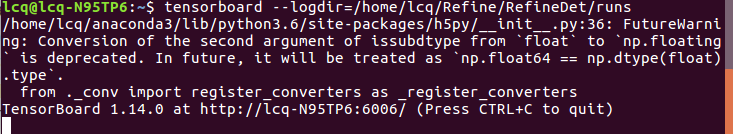 at this point, you can click on the url into the HTTP. But when I used it, I found that it didn’t work.
tensorboard –logdir=run absolute path, this is ok, you can try both!
Read More:
- From the tensorboard command line, enter tensorboard — logdir$$
- Derivation process of gradient descent method based on house price
- Runtimeerror using Python training model: CUDA out of memory error resolution
- Viewing events.out.tfevents file visually in tensorboard
- Solution to unbalanced load of multiple cards (GPU’s 0 card is too high) in Python model training (simple and effective)
- PCL: error encountered in verride found for ‘vtkrenderwindow’ visualization.
- Matplotlib of data visualization plt.xlim The () ylim() function sets the x-axis and y-axis range coordinates
- The Python PIP installation module prompts the error failed to create process
- The problem of failed to create process occurs in pyinstaller package program of Python
- (Copy python package, the problem generated) pip Fatal error in launcher: Unable to create process using
- To solve the problem of increasing video memory when training network (torch)
- How to solve oserror: [errno 98] address already in use and kill the python3 process
- Pandas read_ Error in json() valueerror: training data
- Error running docker container: starting container process caused “exec: \“python\“: executable file
- RuntimeError: cudnn RNN backward can only be called in training mode
- Solve the problem of Python in Windows environment: Fatal error in launcher: Unable to create process using’”‘ in pip installation
- RuntimeError: Default process group has not been initialized, please make sure to call init_process_
- Error in machine learning training data (FIT): valuee rror:Unknown label type:‘continuous‘
- Simple license plate recognition based on Halcon
- [solution] build vins and orb-slam based on opencv4