Python — using Matplotlib to draw histogram
1. Basic histogram
First, install Matplotlib( http://matplotlib.org/api/pyplot_ api.html#matplotlib . pyplot.plot )You can use the PIP command to install it directly
# -*- coding: utf-8 -*-
import matplotlib.pyplot as plt

num_list = [1.5,0.6,7.8,6]
plt.bar(range(len(num_list)), num_list)
plt.show()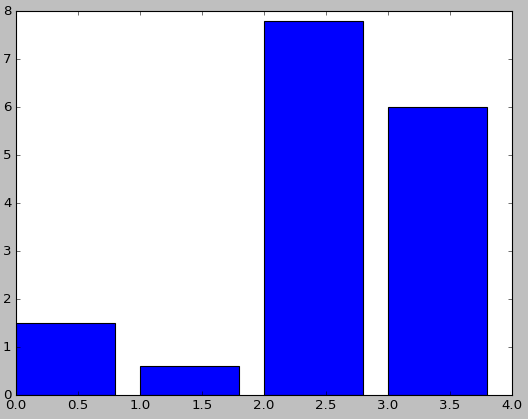
2. Set color
# -*- coding: utf-8 -*-
import matplotlib.pyplot as plt

num_list = [1.5,0.6,7.8,6]
plt.bar(range(len(num_list)), num_list,fc='r')
plt.show()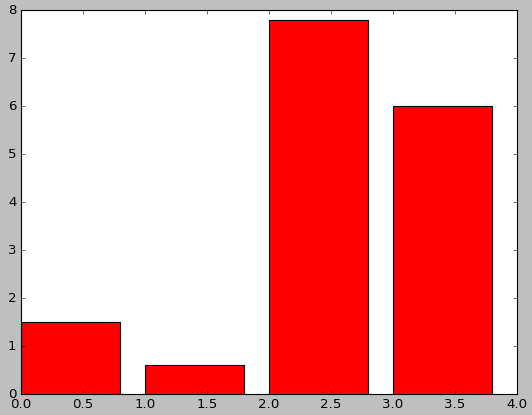
# -*- coding: utf-8 -*-
import matplotlib.pyplot as plt

num_list = [1.5,0.6,7.8,6]
plt.bar(range(len(num_list)), num_list,color='rgb')
plt.show()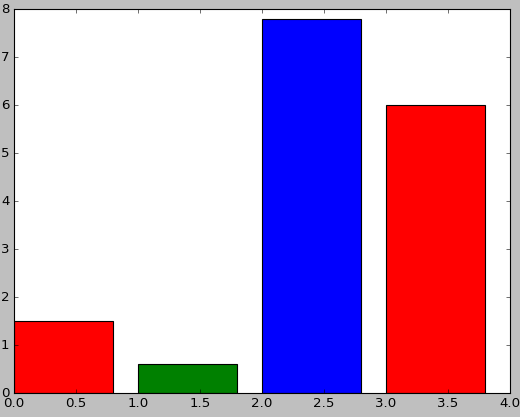
3. Set label
# -*- coding: utf-8 -*-
import matplotlib.pyplot as plt

name_list = ['Monday','Tuesday','Friday','Sunday']
num_list = [1.5,0.6,7.8,6]
plt.bar(range(len(num_list)), num_list,color='rgb',tick_label=name_list)
plt.show()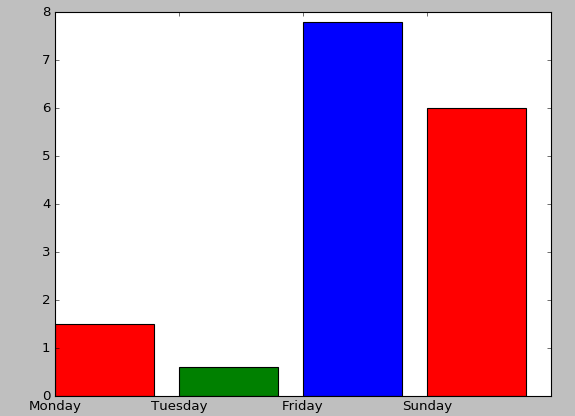
4. Stacked bar chart
# -*- coding: utf-8 -*-
import matplotlib.pyplot as plt

name_list = ['Monday','Tuesday','Friday','Sunday']
num_list = [1.5,0.6,7.8,6]
num_list1 = [1,2,3,1]
plt.bar(range(len(num_list)), num_list, label='boy',fc = 'y')
plt.bar(range(len(num_list)), num_list1, bottom=num_list, label='girl',tick_label = name_list,fc = 'r')
plt.legend()
plt.show()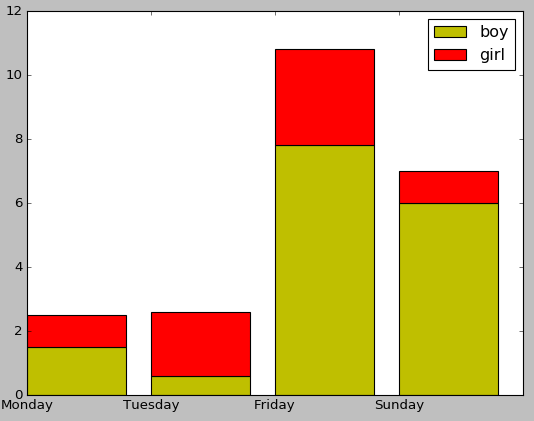
5. Side by side bar chart
# -*- coding: utf-8 -*-
import matplotlib.pyplot as plt

name_list = ['Monday','Tuesday','Friday','Sunday']
num_list = [1.5,0.6,7.8,6]
num_list1 = [1,2,3,1]
x =list(range(len(num_list)))
total_width, n = 0.8, 2
width = total_width / n

plt.bar(x, num_list, width=width, label='boy',fc = 'y')
for i in range(len(x)):
    x[i] = x[i] + width
plt.bar(x, num_list1, width=width, label='girl',tick_label = name_list,fc = 'r')
plt.legend()
plt.show()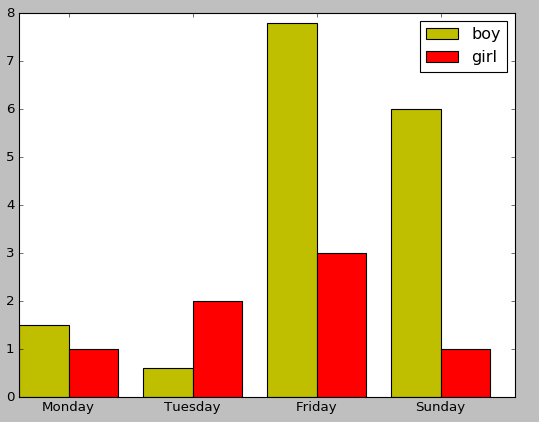
6. Bar chart
# -*- coding: utf-8 -*-
import matplotlib.pyplot as plt

name_list = ['Monday','Tuesday','Friday','Sunday']
num_list = [1.5,0.6,7.8,6]
plt.barh(range(len(num_list)), num_list,tick_label = name_list)
plt.show()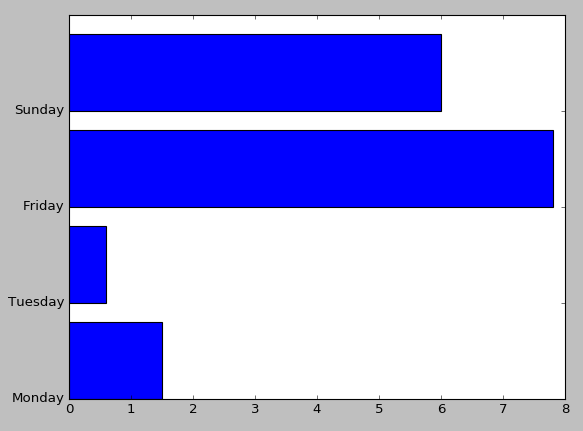
Read More:
- Python combined with Matplotlib to add button
- Error in installing Matplotlib Library: permissionerror: [errno 13] permission denied: ‘/ usr / local / lib / python3.6’
- Python Anaconda Spyder can’t display pictures by using Matplotlib. Error report solution: figures now render in the plots pane by default. To mak
- matplotlib 1.3.1 requires nose, which is not installed. matplotlib 1.3.1 requires tornado, which is
- Import Matplotlib.pyplot as plt Error KeyError: ‘pylab’
- Matplotlib of data visualization plt.xlim The () ylim() function sets the x-axis and y-axis range coordinates
- matplotlib error – no module named tkinter
- 1 vs20152017 + OpenGL to configure and draw a white rectangle
- Finally solved the importError: DLLload failed: the specified module could not be found when import matplotlib.pyplot
- Solving attributeerror: module ‘Matplotlib’ has no attribute ‘artist’
- Solving attributeerror: module ‘Matplotlib’ has no attribute ‘plot‘
- [181124] VC + + use OpenGL to draw 3D graphics example source code
- Origin — draw the curve with error bar
- Matlab draw logarithmic coordinates!
- How does lightningchart, a high performance chart control, draw maps in 3D?
- “Typeerror: invalid dimensions for image data” in Matplotlib drawing imshow() function
- Anaconda Matplotlib drawing Chinese garbled solution
- VC + + OpenGL is used as the development platform to design the program, which can generate any pixel on the screen, and use the pixel to draw the basic graphics
- Solve the problem of unable to locate package python3.6 when upgrading from python3.5 to python3.6 in ubantu16.04
- Can’t find Python executable “D:\python3\python.exe”, you can set the PYTHON env variable.