An error occurred when ecarts component was introduced into Vue project: “error: initialize failed:invalid dom. ”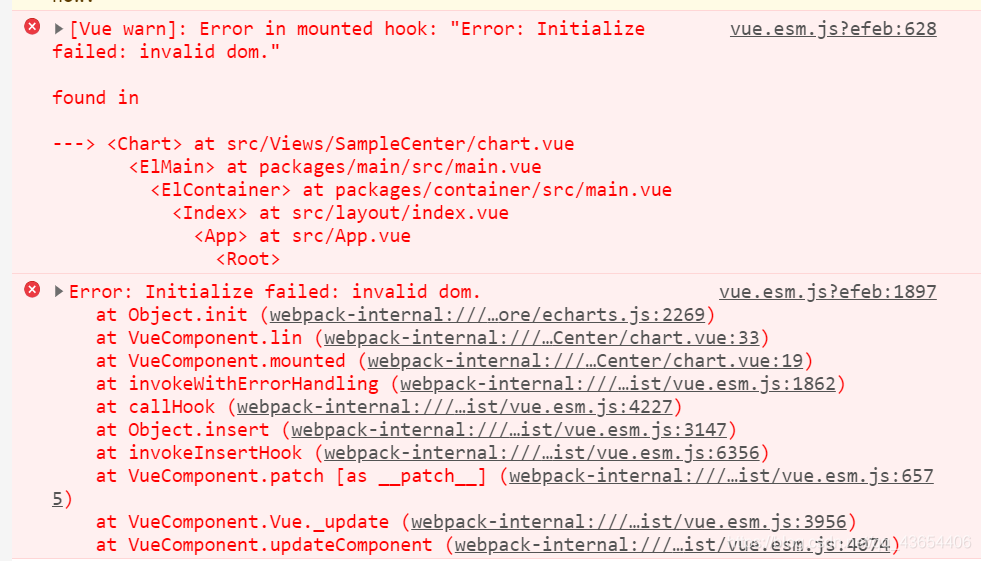
I found that I didn’t reach that level at all. The problem I encountered was that I didn’t quote correctly. I split up. Xiaobai grew up in tears and blood. He didn’t talk much nonsense. Write an article and record it.
The main reason is that I didn’t understand the reference method of ecarts component. Here is my solution
<div id="a" style="height:80vh;width:100%" ref="b"></div>
There are two ways, one is Ref
let mychart = this.$echarts.init(this.$refs.b)
A way of using ID
this.$echarts.init(document.getElementById("a"))
The following is the complete code of the ecart component that I quoted. I have highlighted the mistakes I made. I hope it can help you.
<template>
  <div id="a" style="height:80vh;width:100%" ref="b"></div>
</template>
<script>
mounted() {
      this.init()

  },

  methods: {
      init(){
          let mychart = this.$echarts.init(this.$refs.b)
          // let mychart = this.$charts.init(document.getElementById("a"))
          //Here, I am the problem here, did not understand the whole id and ref relationship
          let optionline = {
              backgroundColor: '#f0f0f0',
    title: {
        text: 'Folding Line Chart',
        textStyle: {
            align: 'center',
            color: '#99CCFF',
            fontSize: 20,
        },
        top: '5%',
        left: 'center',
    },
    tooltip: {
        trigger: 'axis',
        axisPointer: {
            lineStyle: {
                color: {
                    type: 'linear',
                    x: 0,
                    y: 0,
                    x2: 0,
                    y2: 1,
                    colorStops: [{
                        offset: 0,
                        color: 'rgba(0, 255, 233,0)'
                    }, {
                        offset: 0.5,
                        color: 'rgba(255, 255, 255,1)',
                    }, {
                        offset: 1,
                        color: 'rgba(0, 255, 233,0)'
                    }],
                    global: false
                }
            },
        },
    },
    grid: {
        top: '15%',
        left: '5%',
        right: '5%',
        bottom: '15%',
        // containLabel: true
    },
    xAxis: [{
        type: 'category',
        axisLine: {
            show: true
        },
        splitArea: {
            // show: true,
            color: '#f00',
            lineStyle: {
                color: '#f00'
            },
        },
        axisLabel: {
            color: '#fff'
        },
        splitLine: {
            show: false
        },
        boundaryGap: false,
        data: ['A', 'B', 'C', 'D', 'E', 'F'],

    }],

    yAxis: [{
        type: 'value',
        min: 0,
        // max: 140,
        splitNumber: 4,
        splitLine: {
            show: true,
            lineStyle: {
                color: 'rgba(255,255,255,0.1)'
            }
        },
        axisLine: {
            show: false,
        },
        axisLabel: {
            show: false,
            margin: 20,
            textStyle: {
                color: '#d1e6eb',

            },
        },
        axisTick: {
            show: false,
        },
    }],
    series: [{
            name: 'Total registration',
            type: 'line',
            // smooth: true, // whether smooth
            showAllSymbol: true,
            // symbol: 'image://./static/images/guang-circle.png',
            symbol: 'circle',
            symbolSize: 25,
            lineStyle: {
                normal: {
                    color: "#6c50f3",
                    shadowColor: 'rgba(0, 0, 0, .3)',
                    shadowBlur: 0,
                    shadowOffsetY: 5,
                    shadowOffsetX: 5,
                },
            },
            label: {
                show: true,
                position: 'top',
                textStyle: {
                    color: '#6c50f3',
                }
            },
            itemStyle: {
                color: "#6c50f3",
                borderColor: "#fff",
                borderWidth: 3,
                shadowColor: 'rgba(0, 0, 0, .3)',
                shadowBlur: 0,
                shadowOffsetY: 2,
                shadowOffsetX: 2,
            },
            tooltip: {
                show: false
            },
            areaStyle: {
                normal: {
                    color: this.$echarts.graphic.LinearGradient(0, 0, 0, 1, [{
                            offset: 0,
                            color: 'rgba(108,80,243,0.3)'
                        },
                        {
                            offset: 1,
                            color: 'rgba(108,80,243,0)'
                        }
                    ], false),
                    shadowColor: 'rgba(108,80,243, 0.9)',
                    shadowBlur: 20
                }
            },
            data: [502.84, 205.97, 332.79, 281.55, 398.35, 214.02, ]
        },
        {
            name: 'Total registration',
            type: 'line',
            // smooth: true, // whether smooth
            showAllSymbol: true,
            // symbol: 'image://./static/images/guang-circle.png',
            symbol: 'circle',
            symbolSize: 25,
            lineStyle: {
                normal: {
                    color: "#00ca95",
                    shadowColor: 'rgba(0, 0, 0, .3)',
                    shadowBlur: 0,
                    shadowOffsetY: 5,
                    shadowOffsetX: 5,
                },
            },
            label: {
                show: true,
                position: 'top',
                textStyle: {
                    color: '#00ca95',
                }
            },

            itemStyle: {
                color: "#00ca95",
                borderColor: "#fff",
                borderWidth: 3,
                shadowColor: 'rgba(0, 0, 0, .3)',
                shadowBlur: 0,
                shadowOffsetY: 2,
                shadowOffsetX: 2,
            },
            tooltip: {
                show: false
            },
            areaStyle: {
                normal: {
                    color: this.$echarts.graphic.LinearGradient(0, 0, 0, 1, [{
                            offset: 0,
                            color: 'rgba(0,202,149,0.3)'
                        },
                        {
                            offset: 1,
                            color: 'rgba(0,202,149,0)'
                        }
                    ], false),
                    shadowColor: 'rgba(0,202,149, 0.9)',
                    shadowBlur: 20
                }
            },
            data: [281.55, 398.35, 214.02, 179.55, 289.57, 356.14, ],
        },
    ]
          }
          mychart.setOption(optionline)
      }
  }
</script>
Read More:
- Vue references echats and reports an error initialize failed: invalid DOM
- The echots in Vue reports an error. After obtaining the DOM element, the chart can be displayed. The console still reports an error
- [Solved] Echarts Error: There is a chart instance already initialized on the dom!
- Doris query task failed to initialize storage reader
- termux Failed to initialize runtime
- Uncaught Error: _registerComponent(…): Target container is not a DOM element
- FileZilla server failed to initialize SSL Library
- Invalid host header error in Vue using peanut shell agent
- Linux boot prompt “failed to initialize Hal!” solution
- [Handling Notes] Alternative reasons for Configuration system failed to initialize exception
- unity 3D:Virtual Reality SDK Oculus failed to initialize.
- ERROR Invalid options in vue.config.js: “plugins“ is not allowed
- MySQL — initialize failed to generate temporary password in error log after initialization
- It is invalid to submit the content directly after pasting it on the mobile terminal of Vue HTML5 editor
- Error: Target container is not a DOM element.
- NS_ERROR_DOM_BAD_URI: Access to restricted URI denied
- The app failed to start because there is no Qt platform to initialize
- Unity3d open prompt failed to initialize unity graphic
- failed to lazily initialize a collection of role: ……, no session or session was closed
- UserWarning: Failed to initialize NumPy: No module named ‘numpy.core._multiarray_umath‘