Tag Archives: chart

[Solved] Echarts Error: TypeError: Cannot read properties of null (reading getAttribute )

The above problem was encountered when using echarts

Generally, there are the following cases.
1. echarts.init(document.getElementById("xxxx") is written in the wrong format, such as adding a # in front of the id.

2. initialize operation when the element is not loaded out (stack a debugger on top of the initialized code to easily determine). Here specifically in vue.

If an error is reported you can put the code inside mounted.
mounted() {    
	this.initEcharts();   
}

Differences between mounted and created:

created:Called before the template is rendered into html, applied to initialize some attribute values and then rendered into view requirements.
mounted:Called after the template is rendered into html, to initialize the page and then perform some operations on the dom nodes of the html after it is finished.

[Solved] unhandled error during execution of watcher callback

report errors

unhandled error during execution of watcher callback

analysis

When drawing data with the Echorts icon, an error is reported: unhandled error during execution of watcher callback. The reason for the prompt is that the Echorts chart is rendered before the data is obtained in the current year, which results in the chart cannot being displayed and an error being reported

Solution:

Before data rendering, make a non-empty judgment
for example:

if(value){
	Start rendering data
}

or

if(value !== undefined){
	Start rendering data
}

[Solved] Vue echarts Error: Initialize failed: invalid dom.

Error reporting reason

DOM has not been mounted yet, echarts.init() has already started execution

resolvent

1. Don’t use created, use mounted. Created just creates an instance at this time, but the template hasn’t been mounted yet

created:Called before the template is rendered into html, i.e. usually initialize some property values and then render into view.
mounted: called after the template is rendered into html, usually after initializing the page and then doing some required operations on the html dom nodes

That is to say, the created() method is called before the page is loaded, and DOM is not loaded yet. So use mounted when DOM is changed, and use created when DOM is not changed

2. Use setTimeout to delay loading

[Solved] Echarts Error: Uncaught (in promise) Error: Initialize failed: invalid dom.

Problem screenshot: the reason for

Cause: After entering the chart page and calling the Get Chart Data interface, the interface jumps away from the chart page before returning the data, and then the data is returned and the chart is created, but after jumping away from the chart page, the container element is not available, so an error is reported and the chart creation fails.

Solution:
1. Instead of using the native js method to get the container element (e.g. document.getElementById()), use this.$refs instead.
2. If the chart page is a cached page and you want the chart to load after jumping back to the chart page, you need to write the width and height of the container (in px) in the in-line style of the chart container. (For cached pages there is also another solution: execute the create chart method in the activated life cycle of the component)

<div ref="chinaMapChart" style="width: 770px; height: 560px" />

------

const myChart = echarts.init(this.$refs.chinaMapChart)

[Solved] ECharts Console Error: `resize` should not be called during main process

When using ecarts, the console reports an error ` resize ` should not be called during main process


This situation may occur in the scenario where echarts is used in combination with Vue 3, especially after the echarts instance is wrapped with Ref.

This article is excerpted from another blog post, the use of echarts 5 in the development of Vue 3


1. Problem analysis

In general, the encapsulation of ecarts chart does not need to expose the ecarts object to the rendering context. If you do intend to declare an echots object as a response, use shallowref instead of ref:

// GOOD
const chart = shallowRef<echarts.ECharts>(); 

// BAD
const chart = ref<echarts.ECharts>();

If you do not use shallowref, the command line may report an error ‘resize’ should not be called during main process; In fact, any instance created by a third-party library should be processed responsively using shallowref instead of ref.

[Solved] Echart Error: Typeerror: axis Getaxesonzeroof is not a function

When using echart, it is clear that all parameters are passed in, but this. Is used in echart When init() initializes, it reports an error typeerror: axis Getaxesonzeroof is not a function. Through exclusion one by one, it is found that this error will occur when the data in the xaxis attribute is [].

Of course, my problem is not your problem, please analyze the specific problem!!!

My xaxis:

xAxis: {
    type: 'category',
    axisTick: {
      alignWithLabel: true
    },
    data: data
  }

Finally, my solution is:

if (this.data.length) {
  this.dom.setOption(option);
} else {
  this.dom.setOption({});   // Auto replace the first option
}

[Solved] Vue E-Charts Error: These dependencies were not found:

Error reporting background

At present, I am working on a single page project of Vue. I temporarily replaced the system disk because I started a new project, which is actually a very easy reason to think of. However, the error “pointing to a component can not be found” on the console page at that time. In my mind, I first thought that there was a problem with my own partial introduction. After checking many introduction methods, I found that it did not seem to be the problem, Later, the reaction may be that the original things were moved because the disk was changed, and the dependencies are not in the current project directory. Although the version number of eckards is registered in package.json, the things are not detected by moudule, so naturally they can’t be retrieved.

Solution:

There is no problem running my code in the original environment, so the solution is very simple. Just download the required ecarts package and run the following command

// echarts download code
cnpm install [email protected] --save
//the reaseon for limiting version number:default 5 dont conatin Map components

Of course, because I changed the disk, I didn’t even have NPM, not to mention cnpm, not even inode… Of course, if you encounter these problems, just download the corresponding version you need
after downloading the dependencies, you can first go to package.json or the dependency file corresponding to your own project to check whether it is registered correctly, and then check whether the module has a corresponding package to develop a good development habit

result

After NPM running again, the IDE screen is displayed normally and the web page is displayed normally, OK.
(the picture will not be displayed here, otherwise the information security will be leaked.)

Vue-echarts error: was not found in vue-demi [How to Solve]

Was not found in Vue Demi

version problem. Vue-echarts6.0.0 is vue3. When it is introduced into vue2, an alarm will appear
you can go back to version 4.0.2

npm install [email protected] -S

Vue-echarts4.0.2 corresponds to echarts4, so echats also returns the version

npm install [email protected] -S

Prompt personal version record

"dependencies": {
    "core-js": "^3.6.5",
    "echarts": "^4.9.0",
    "vue": "^2.6.11",
    "vue-echarts": "^4.0.2"
  },

Introduce in main.js

import ECharts from 'vue-echarts'
// import * as echarts from 'echarts' //Global introduction
// Vue.prototype.$echats = echarts;
import 'echarts/lib/chart/line' // On-demand introduction
Vue.component('chart', ECharts)

#An error is reported by the chart map component of renfast framework

#An error is reported by the chart map component of renfast framework

##Bug:
you can’t install your own version of ecarts all the time. The console always comes out with 3.84 (actually 4.9.0 is installed)
and the following error will be reported if you reference the map component

##Reason:
in the renfast framework, the plugins preset the ecarts plug-in (3.8.5), and set// to import an external library, without the need for webpack packaging

##Handling method:
if you reference your own installed ecarts, you need to comment out the ecarts of external in build \ webpack.base.conf.js

Echarts Map Error: Error: Invalid geoJson format Cannot read property ‘length‘ of undefined

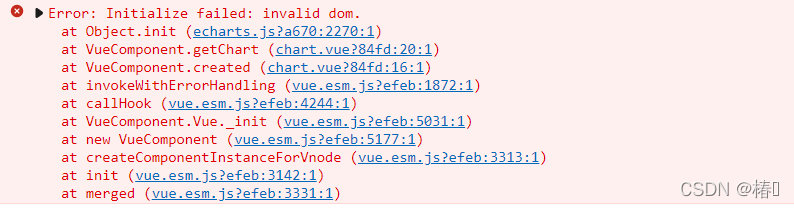
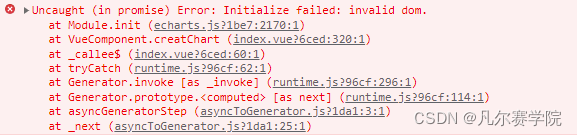
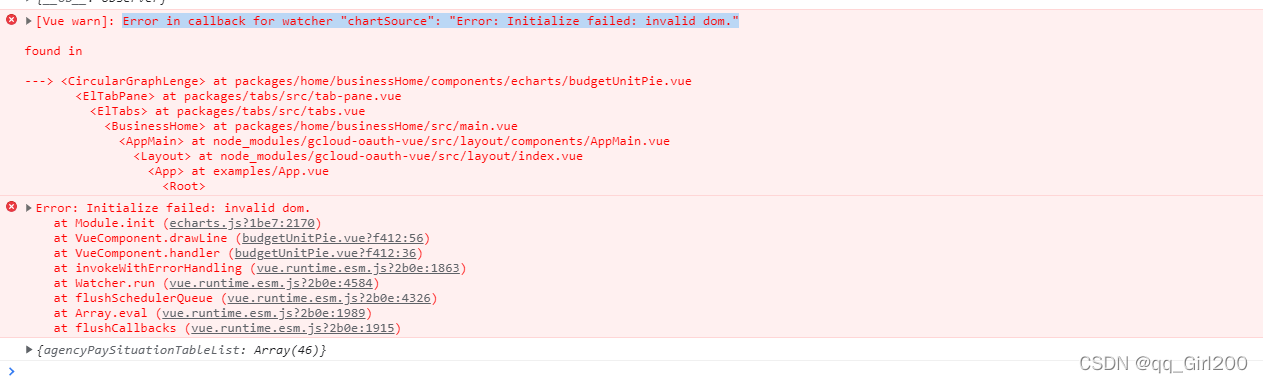
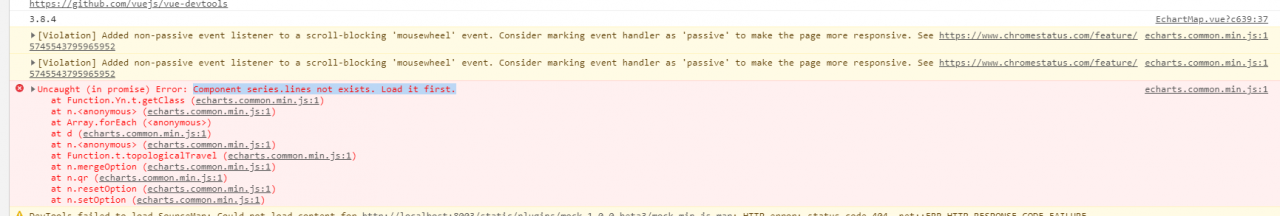
When displaying the districts and counties of Taizhou, Zhejiang Province, I found an error on the page. I found that the difference in the file is that there is a “type”: “geometrycollection”
Modify node in Yuhuan JSON_Modules\charts\lib\coord\geo\parsegeojason.js code

/*
 * Licensed to the Apache Software Foundation (ASF) under one
 * or more contributor license agreements.  See the NOTICE file
 * distributed with this work for additional information
 * regarding copyright ownership.  The ASF licenses this file
 * to you under the Apache License, Version 2.0 (the
 * "License"); you may not use this file except in compliance
 * with the License.  You may obtain a copy of the License at
 *
 *   http://www.apache.org/licenses/LICENSE-2.0
 *
 * Unless required by applicable law or agreed to in writing,
 * software distributed under the License is distributed on an
 * "AS IS" BASIS, WITHOUT WARRANTIES OR CONDITIONS OF ANY
 * KIND, either express or implied.  See the License for the
 * specific language governing permissions and limitations
 * under the License.
 */


/**
 * AUTO-GENERATED FILE. DO NOT MODIFY.
 */

/*
 * Licensed to the Apache Software Foundation (ASF) under one
 * or more contributor license agreements.  See the NOTICE file
 * distributed with this work for additional information
 * regarding copyright ownership.  The ASF licenses this file
 * to you under the Apache License, Version 2.0 (the
 * "License"); you may not use this file except in compliance
 * with the License.  You may obtain a copy of the License at
 *
 *   http://www.apache.org/licenses/LICENSE-2.0
 *
 * Unless required by applicable law or agreed to in writing,
 * software distributed under the License is distributed on an
 * "AS IS" BASIS, WITHOUT WARRANTIES OR CONDITIONS OF ANY
 * KIND, either express or implied.  See the License for the
 * specific language governing permissions and limitations
 * under the License.
 */

/**
 * Parse and decode geo json
 */
import * as zrUtil from 'zrender/lib/core/util';
import Region from './Region';

function decode(json) {
    if (!json.UTF8Encoding) {
        return json;
    }

    var jsonCompressed = json;
    var encodeScale = jsonCompressed.UTF8Scale;

    if (encodeScale == null) {
        encodeScale = 1024;
    }

    var features = jsonCompressed.features;

    for (var f = 0; f < features.length; f++) {
        var feature = features[f];
        var geometry = feature.geometry;

        if (geometry.type === 'Polygon') {
            var coordinates = geometry.coordinates;

            for (var c = 0; c < coordinates.length; c++) {
                coordinates[c] = decodePolygon(coordinates[c], geometry.encodeOffsets[c], encodeScale);
            }
        } else if (geometry.type === 'MultiPolygon') {
            var coordinates = geometry.coordinates;

            for (var c = 0; c < coordinates.length; c++) {
                var coordinate = coordinates[c];

                for (var c2 = 0; c2 < coordinate.length; c2++) {
                    coordinate[c2] = decodePolygon(coordinate[c2], geometry.encodeOffsets[c][c2], encodeScale);
                }
            }
        }
    } // Has been decoded


    jsonCompressed.UTF8Encoding = false;
    return jsonCompressed;
}

function decodePolygon(coordinate, encodeOffsets, encodeScale) {
    var result = [];
    var prevX = encodeOffsets[0];
    var prevY = encodeOffsets[1];

    for (var i = 0; i < coordinate.length; i += 2) {
        var x = coordinate.charCodeAt(i) - 64;
        var y = coordinate.charCodeAt(i + 1) - 64; // ZigZag decoding

        x = x >> 1 ^ -(x & 1);
        y = y >> 1 ^ -(y & 1); // Delta deocding

        x += prevX;
        y += prevY;
        prevX = x;
        prevY = y; // Dequantize

        result.push([x/encodeScale, y/encodeScale]);
    }

    return result;
}

export default function parseGeoJSON(geoJson, nameProperty) {
    decode(geoJson);
    return zrUtil.map(
        zrUtil.filter(geoJson.features, function (featureObj) {
            if (featureObj.geometry.geometries) {
                let geometry = featureObj.geometry.geometries.map(i => {
                    return i.coordinates;
                });
                let { type, properties} = featureObj;
                return {
                    type,
                    properties,
                    geometry
                };
            }
            // Output of mapshaper may have geometry null
            return (
                featureObj.geometry &&
                featureObj.properties &&
                featureObj.geometry.coordinates &&
                featureObj.geometry.coordinates.length > 0
            );
        }),
        function (featureObj) {
            var properties = featureObj.properties;
            var geo = featureObj.geometry;
            var coordinates = geo.coordinates;
            var geometries = [];

            if (geo.type === "GeometryCollection") {
                let geometry = {
                    type: "Polygon"
                };
                let coordinatesArr = featureObj.geometry.geometries.map(i => {
                    return i.coordinates;
                });
                geometry.coordinates = coordinatesArr;
                console.log(coordinatesArr, "coordinatesArr");
                coordinatesArr.forEach(i => {
                    geometries.push({
                        type: "polygon",
                        // According to the GeoJSON specification.
                        // First must be exterior, and the rest are all interior(holes).
                        exterior: i[0],
                        interiors: i.slice(1)
                    });
                });
            }
            if (geo.type === "Polygon") {
                console.log("coordinatesPolygon", coordinates);
                geometries.push({
                    type: "polygon",
                    // According to the GeoJSON specification.
                    // First must be exterior, and the rest are all interior(holes).
                    exterior: coordinates[0],
                    interiors: coordinates.slice(1)
                });
            }

            if (geo.type === "MultiPolygon") {
                zrUtil.each(coordinates, function (item) {
                    if (item[0]) {
                        geometries.push({
                            type: "polygon",
                            exterior: item[0],
                            interiors: item.slice(1)
                        });
                    }
                });
            }
            console.log(
                properties[nameProperty || "name"],
                geometries,
                properties.cp,
                "asdfasdfasdf"
            );
            var region = new Region(
                properties[nameProperty || "name"],
                geometries,
                properties.cp
            );
            region.properties = properties;
            return region;
        })
}