LightningChart is primarily a charting component (charts are graphical representations of data) rather than a virtual environment creation tool. However, LightningChart provides multiple ways to use geographic maps, not only in 2D, but also in 3D.
If you are primarily interested in 3D maps, Artion can provide three examples of possible ideas. First, you can import a map/image into a “chart” and create a surface whose geometry and color are based on map elements (such as shading). Example of this type in ExampleArgesurface:
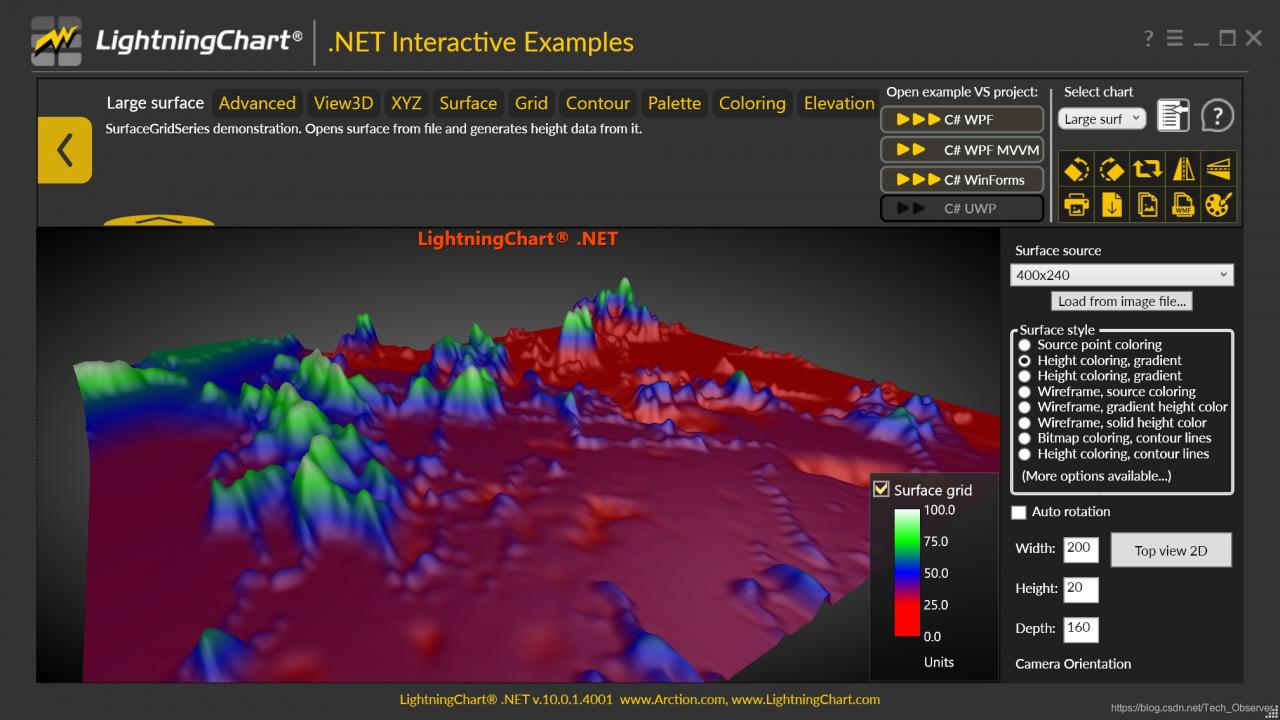
Example large surface
As shown in ExampleGlobal Surface3D, such a surface can be wrapped in any shape
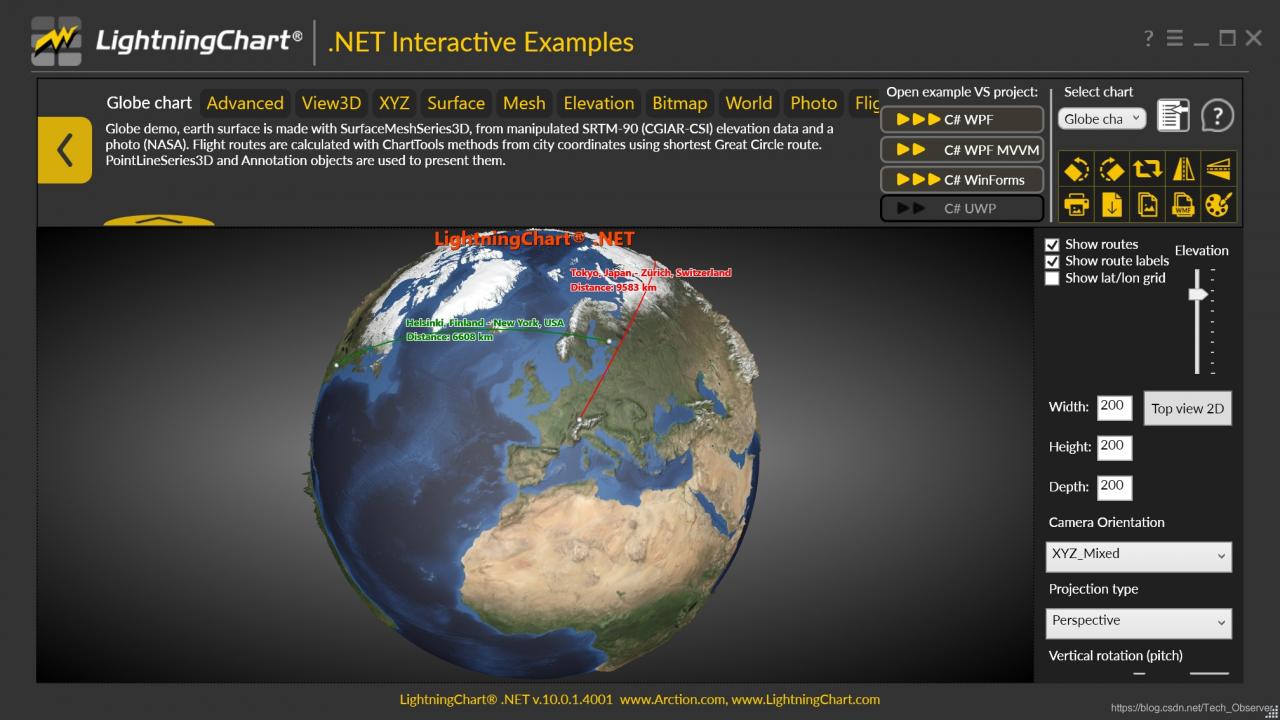
Example Globesurface3D
You can also use the information/data from the map (for example, boundary residents, population size, etc.) to create Chart 3D objects (which can be pointlineseries3D, meshModel, polygon3D, etc.). In ExamplePopulationPolygons3D demonstrates a kind of such a method.
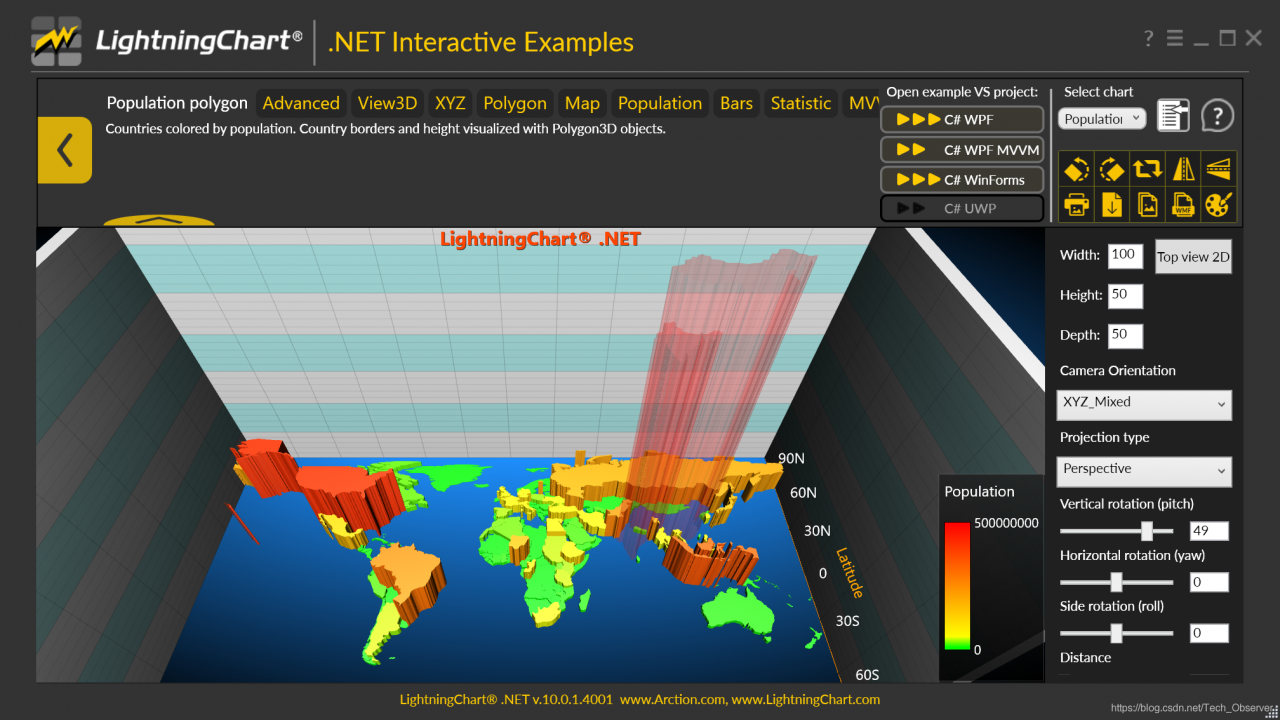
Example population polygon 3D
LightningChart.net is fully GPU-accelerated and optimized for displaying massive amounts of data in real time — over 1 billion data points. LightningChart includes a wide range of 2D, Advanced 3D, Polar, Smith, 3D Pake/Doughnut, Geographic Maps and GIS charts as well as volume mapping capabilities for science, engineering, medicine, aviation, trade, energy and other fields.