Tag Archives: chart

In Vue, use echorts to report an error: “typeerror: cannot read property ‘init’ of undefined” error reporting reason and solution

The latest version of ecarts dependency, version 5. X, is installed through NPM. However, most of the online tutorials are introduced in the way of 4. X, while the introduction method of version 5. X has changed, resulting in an error;

Solution

The method of introducing main.js into ecarts is introduced from 4. X:

import echarts from 'echarts' 

Change to 5. X import mode:

import * as echarts from 'echarts'

The echots in Vue reports an error. After obtaining the DOM element, the chart can be displayed. The console still reports an error

 <div v-if="grade<3" ref="gradeChart" style="height: 220px;width: 300px;margin:0 auto;">


  mounted() {
      this.$nextTick(() => {
				setTimeout(()=>{
					let map1=this.initEchartMap(this.gjfsx);
					console.log(this.$refs.gradeChart,"ddkiiok")
					},50)
      })


  The solution is to change V-IF to v-show, and the console will not report an error

 <div v-show="grade<3" ref="gradeChart" style="height: 220px;width: 300px;margin:0 auto;">

Vue Error: initialize failed: invalid dom [How to Solve]

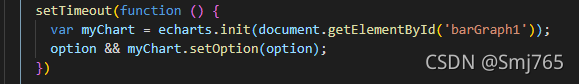
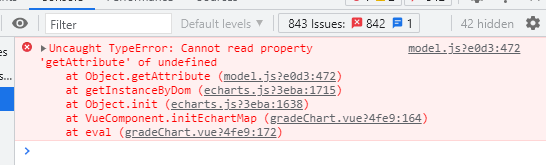
An error occurred when ecarts component was introduced into Vue project: “error: initialize failed:invalid dom. ”

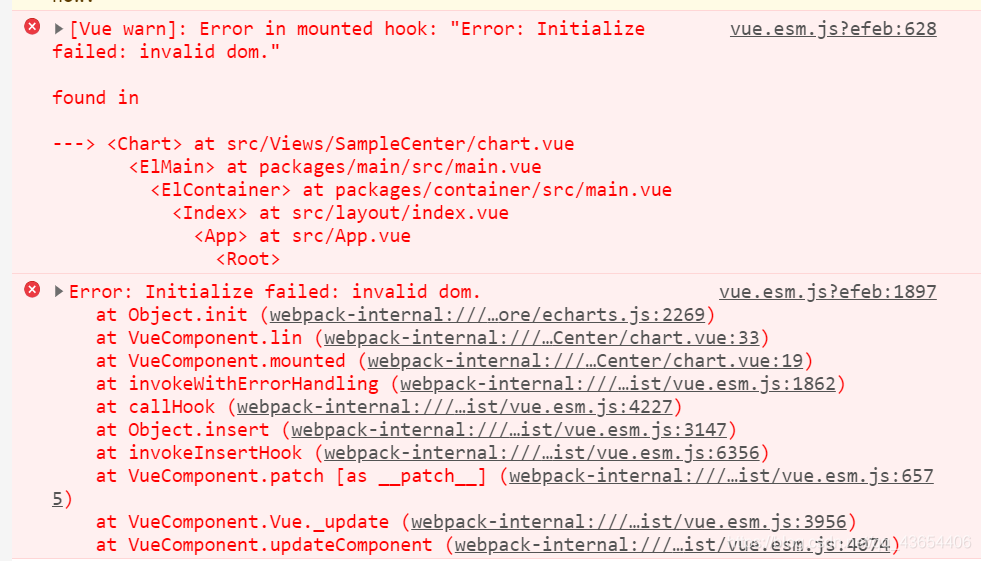
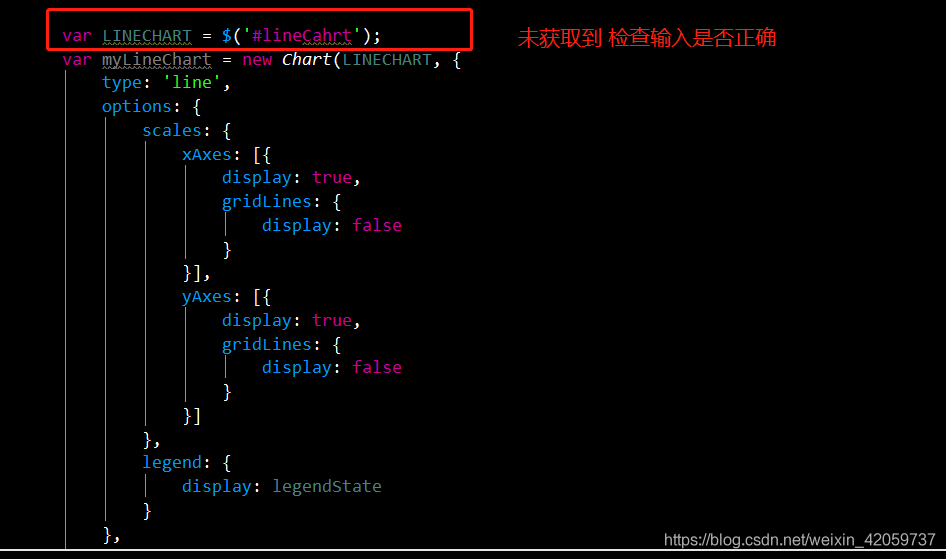
I found that I didn’t reach that level at all. The problem I encountered was that I didn’t quote correctly. I split up. Xiaobai grew up in tears and blood. He didn’t talk much nonsense. Write an article and record it.

The main reason is that I didn’t understand the reference method of ecarts component. Here is my solution

<div id="a" style="height:80vh;width:100%" ref="b"></div>

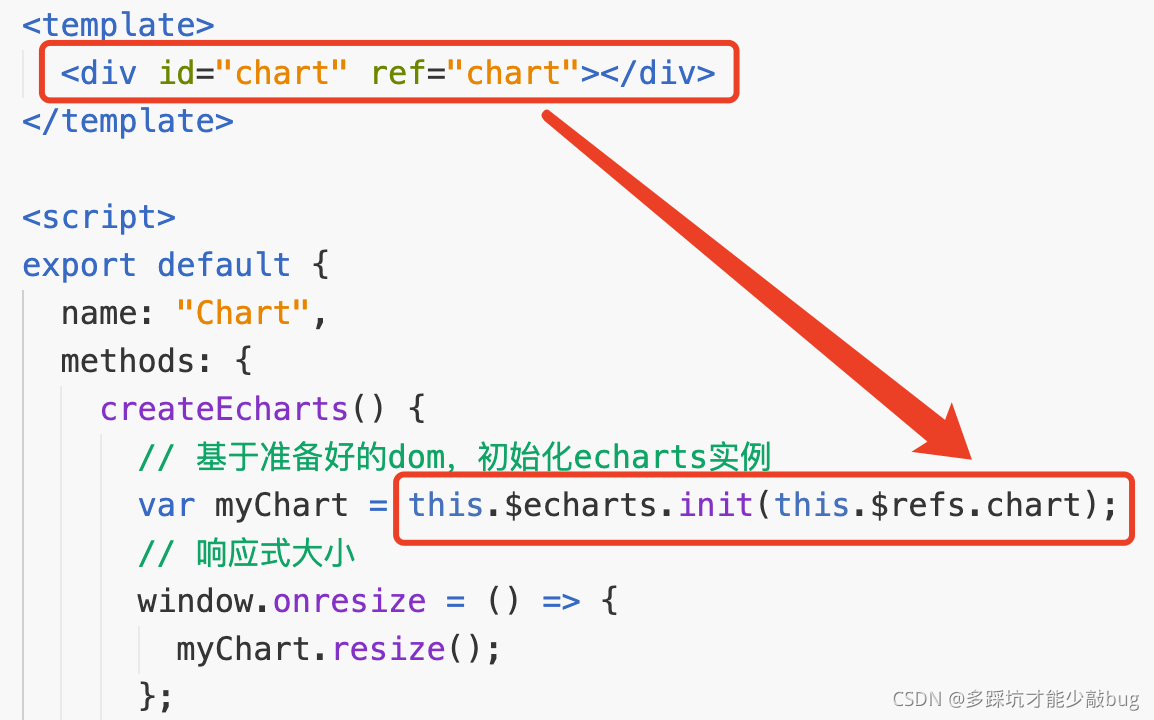
There are two ways, one is Ref

let mychart = this.$echarts.init(this.$refs.b)

A way of using ID

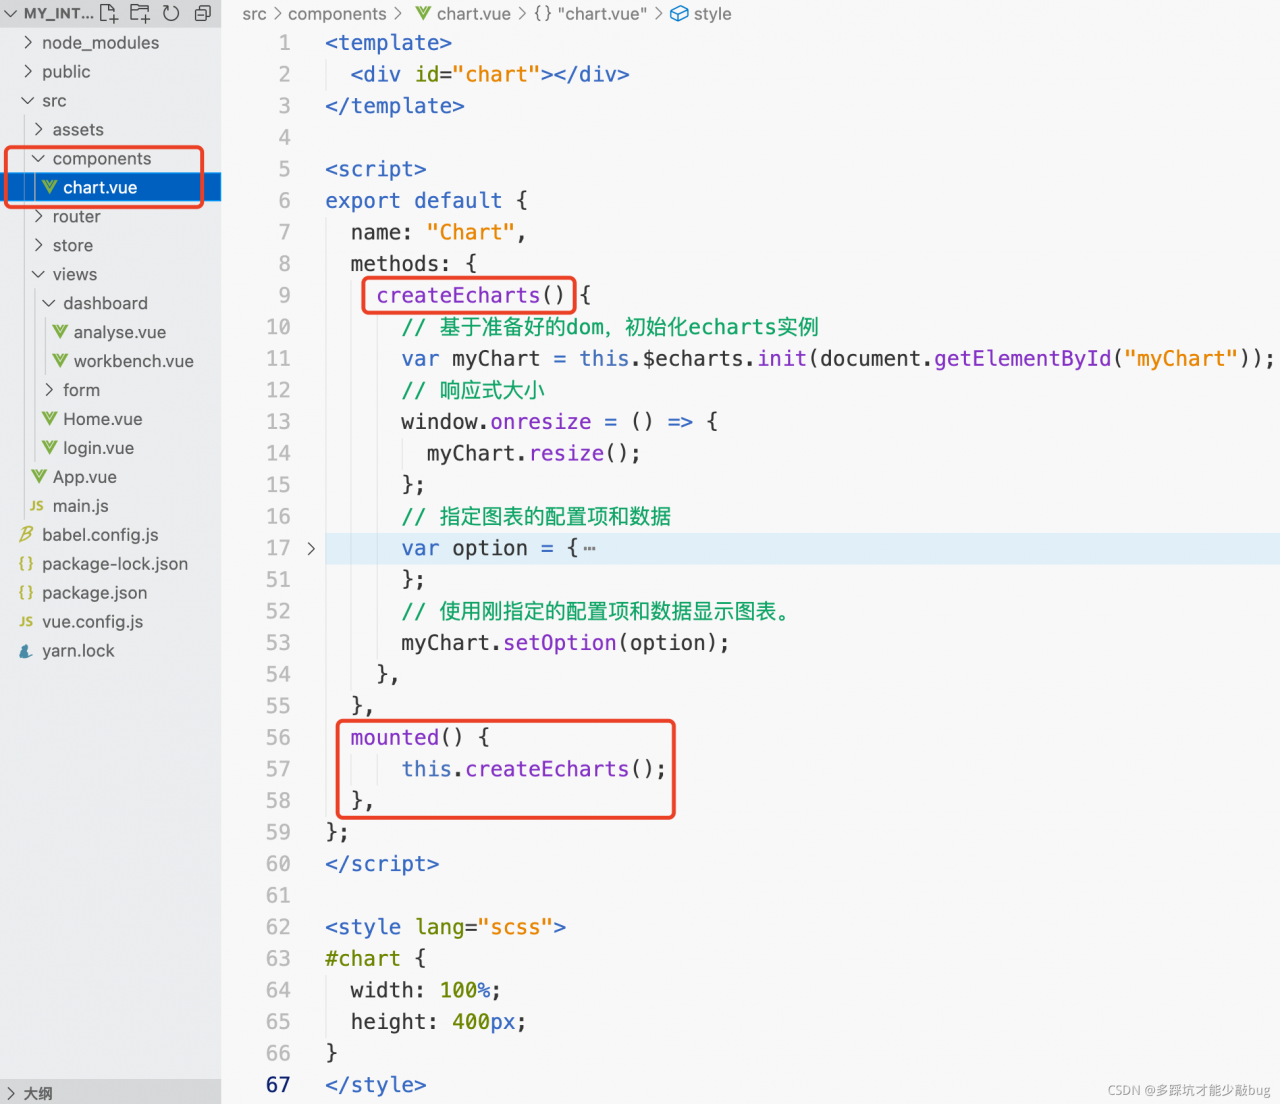
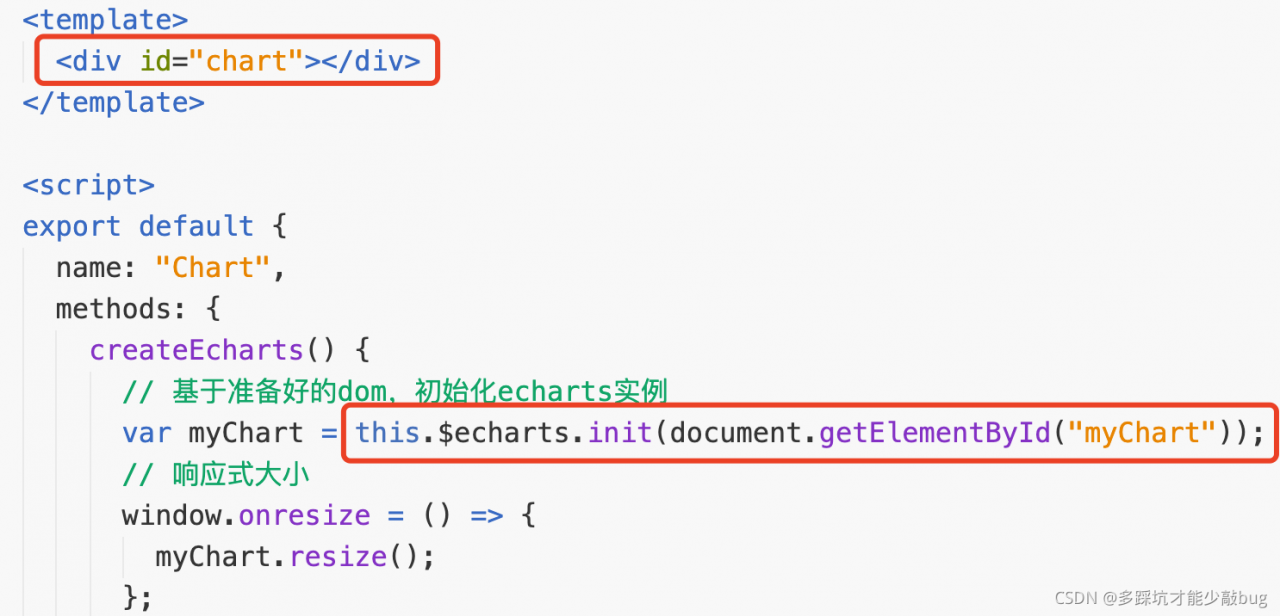
this.$echarts.init(document.getElementById("a"))

The following is the complete code of the ecart component that I quoted. I have highlighted the mistakes I made. I hope it can help you.

<template>
  <div id="a" style="height:80vh;width:100%" ref="b"></div>
</template>
<script>
mounted() {
      this.init()

  },
 
  methods: {
      init(){
          let mychart = this.$echarts.init(this.$refs.b)
          // let mychart = this.$charts.init(document.getElementById("a"))
          //Here, I am the problem here, did not understand the whole id and ref relationship
          let optionline = {
              backgroundColor: '#f0f0f0',
    title: {
        text: 'Folding Line Chart',
        textStyle: {
            align: 'center',
            color: '#99CCFF',
            fontSize: 20,
        },
        top: '5%',
        left: 'center',
    },
    tooltip: {
        trigger: 'axis',
        axisPointer: {
            lineStyle: {
                color: {
                    type: 'linear',
                    x: 0,
                    y: 0,
                    x2: 0,
                    y2: 1,
                    colorStops: [{
                        offset: 0,
                        color: 'rgba(0, 255, 233,0)'
                    }, {
                        offset: 0.5,
                        color: 'rgba(255, 255, 255,1)',
                    }, {
                        offset: 1,
                        color: 'rgba(0, 255, 233,0)'
                    }],
                    global: false
                }
            },
        },
    },
    grid: {
        top: '15%',
        left: '5%',
        right: '5%',
        bottom: '15%',
        // containLabel: true
    },
    xAxis: [{
        type: 'category',
        axisLine: {
            show: true
        },
        splitArea: {
            // show: true,
            color: '#f00',
            lineStyle: {
                color: '#f00'
            },
        },
        axisLabel: {
            color: '#fff'
        },
        splitLine: {
            show: false
        },
        boundaryGap: false,
        data: ['A', 'B', 'C', 'D', 'E', 'F'],

    }],

    yAxis: [{
        type: 'value',
        min: 0,
        // max: 140,
        splitNumber: 4,
        splitLine: {
            show: true,
            lineStyle: {
                color: 'rgba(255,255,255,0.1)'
            }
        },
        axisLine: {
            show: false,
        },
        axisLabel: {
            show: false,
            margin: 20,
            textStyle: {
                color: '#d1e6eb',

            },
        },
        axisTick: {
            show: false,
        },
    }],
    series: [{
            name: 'Total registration',
            type: 'line',
            // smooth: true, // whether smooth
            showAllSymbol: true,
            // symbol: 'image://./static/images/guang-circle.png',
            symbol: 'circle',
            symbolSize: 25,
            lineStyle: {
                normal: {
                    color: "#6c50f3",
                    shadowColor: 'rgba(0, 0, 0, .3)',
                    shadowBlur: 0,
                    shadowOffsetY: 5,
                    shadowOffsetX: 5,
                },
            },
            label: {
                show: true,
                position: 'top',
                textStyle: {
                    color: '#6c50f3',
                }
            },
            itemStyle: {
                color: "#6c50f3",
                borderColor: "#fff",
                borderWidth: 3,
                shadowColor: 'rgba(0, 0, 0, .3)',
                shadowBlur: 0,
                shadowOffsetY: 2,
                shadowOffsetX: 2,
            },
            tooltip: {
                show: false
            },
            areaStyle: {
                normal: {
                    color: this.$echarts.graphic.LinearGradient(0, 0, 0, 1, [{
                            offset: 0,
                            color: 'rgba(108,80,243,0.3)'
                        },
                        {
                            offset: 1,
                            color: 'rgba(108,80,243,0)'
                        }
                    ], false),
                    shadowColor: 'rgba(108,80,243, 0.9)',
                    shadowBlur: 20
                }
            },
            data: [502.84, 205.97, 332.79, 281.55, 398.35, 214.02, ]
        },
        {
            name: 'Total registration',
            type: 'line',
            // smooth: true, // whether smooth
            showAllSymbol: true,
            // symbol: 'image://./static/images/guang-circle.png',
            symbol: 'circle',
            symbolSize: 25,
            lineStyle: {
                normal: {
                    color: "#00ca95",
                    shadowColor: 'rgba(0, 0, 0, .3)',
                    shadowBlur: 0,
                    shadowOffsetY: 5,
                    shadowOffsetX: 5,
                },
            },
            label: {
                show: true,
                position: 'top',
                textStyle: {
                    color: '#00ca95',
                }
            },

            itemStyle: {
                color: "#00ca95",
                borderColor: "#fff",
                borderWidth: 3,
                shadowColor: 'rgba(0, 0, 0, .3)',
                shadowBlur: 0,
                shadowOffsetY: 2,
                shadowOffsetX: 2,
            },
            tooltip: {
                show: false
            },
            areaStyle: {
                normal: {
                    color: this.$echarts.graphic.LinearGradient(0, 0, 0, 1, [{
                            offset: 0,
                            color: 'rgba(0,202,149,0.3)'
                        },
                        {
                            offset: 1,
                            color: 'rgba(0,202,149,0)'
                        }
                    ], false),
                    shadowColor: 'rgba(0,202,149, 0.9)',
                    shadowBlur: 20
                }
            },
            data: [281.55, 398.35, 214.02, 179.55, 289.57, 356.14, ],
        },
    ]
          }
          mychart.setOption(optionline)
      }
  }
</script>

Chart.min.js:10 Failed to create chart: can’t acquire context from the given item

exception resolution chart.min.js :10 Failed to create Chart: can’t acquire context from the given item

      • this exception is a front-end exception

The exception

is a front-end exception

error in using chart. Js in initializing report
cause: error in obtaining dom without obtaining the specified dom or not giving a dom object to chart cannot initialize
reference link