Tag Archives: python

[Solved] Pandas rename Error: ValueError: operands could not be broadcast together with shapes (1,2) (3,) (1,2)

Pandas rename reported an error valueerror

error message

ValueError: operands could not be broadcast together with shapes (1,2) (3,) (1,2) 

Solution:

The initial investigation is that the pandas version is low, and the pandas version needs to be updated.初步排查是pandas版本较低导致,需要更新pandas版本。

Reference version

Current version: Pandas 1.1.3 updated version: Pandas 1.4.1

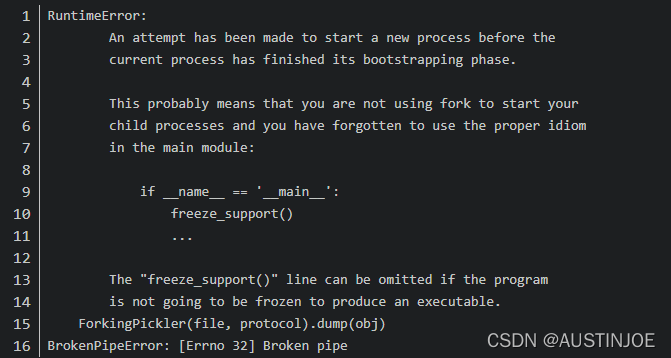
Pytorch Run Error: BrokenPipeError [How to Solve]

The problem occurs when doing machine learning training.

Reason for the error: The problem is due to multi-threading under windows, and is related to the DataLoader class. Just change the number of num_workers to 0. This is a bug in windows.

The error code can be referred to:

trainLoader=torch.utils.data.DataLoader(trainSet,batch_size=Bach_Size,shuffle=True,num_workers=2)
testLoader=torch.utils.data.DataLoader(testSet,batch_size=Bach_Size,shuffle=True,num_workers=2)

Set The number of num_ workers to 0

trainLoader=torch.utils.data.DataLoader(trainSet,batch_size=Bach_Size,shuffle=True,num_workers=0)
testLoader=torch.utils.data.DataLoader(testSet,batch_size=Bach_Size,shuffle=True,num_workers=0)

[Solved] Torch Build Module Error: NotImplementedError

It’s probably such an error reporting method. I’ve been using torch for so many years. I first encountered this error NotImplementedError
I’m not using a nightly version

Traceback (most recent call last):

  File "xxxxx\x.py", line 268, in <module>
    print(x(y).shape)

  File "xxxxx\lib\site-packages\torch\nn\modules\module.py", line 889, in _call_impl
    result = self.forward(*input, **kwargs)

  File "xxxxx\x.py", line 259, in forward
    x = self.features(x)

  File "xxxxx\lib\site-packages\torch\nn\modules\module.py", line 889, in _call_impl
    result = self.forward(*input, **kwargs)

  File "xxxxx\lib\site-packages\torch\nn\modules\container.py", line 119, in forward
    input = module(input)

  File "xxxxx\lib\site-packages\torch\nn\modules\module.py", line 889, in _call_impl
    result = self.forward(*input, **kwargs)

  File "xxxxx\lib\site-packages\torch\nn\modules\module.py", line 201, in _forward_unimplemented
    raise NotImplementedError

NotImplementedError

Call self.forward in _call_impl

result = self.forward(*input, **kwargs)

If you inherit nn.Module, and if you don’t implement self.forward, it will

raise NotImplementedError

It turns out that when I use this function, I really don’t have the forward method:

class Hswish(nn.Module):

    def __init__(self, inplace=True):
        super(Hswish, self).__init__()
        self.inplace = inplace

    def __swish(self, x, beta, inplace=True):
        # But this swish is not used by H-swish
        # The reason it's called H-swish is to make the sigmoid hard
        # approximated by Relu6(x+3)/6
        # Reduced computational effort for embedded deployment
        return x * F.sigmoid(beta * x, inplace)

    @staticmethod
    def Hsigmoid(x, inplace=True):
        return F.relu6(x + 3, inplace=inplace)/6

    def foward(self, x):
        return x * self.Hsigmoid(x, self.inplace)

forward Write as foward

Python Kmeans Error: ConvergenceWarning: Number of distinct clusters (99) found smaller than n_clusters (100).

The following errors occur when using the kmeans method for clustering. My default setting is 100 categories, and there are more than 100 data. The following errors are reported in the clustering process:

ConvergenceWarning: Number of distinct clusters (99) found smaller than n_clusters (100). Possibly due to duplicate points in X.

First locate the error code:

kmeans = KMeans(n_clusters=k, random_state=2018)
kmeans.fit(XData)
 pre_y = kmeans.predict(XData)

It is probably one of these three items. Finally, it is found that the prompt appears in the fit() function. Use the try method to grab the error, locate the breakpoint for debugging, and grab the ConvergenceWarning error:

    # Build the clustering model object
    kmeans = KMeans(n_clusters=k, random_state=2018)
    # Train the clustering model
    try:
        kmeans.fit(XData) # If the data has duplicates, the data will be smaller than the K value when fitting, so the K value needs to be updated
    except ConvergenceWarning:
        print("Catch ConvergenceWarning,k={}\n".format(k))
    except:
        print("k={}\n".format(k))

    # Predictive Clustering Model
    pre_y = kmeans.predict(XData)

After checking, the outgoing line is caused by repeated XData data, so the K value is determined in the early stage, and the problem can be solved by repeating it here
previous K value determination Code:

XData = np.array(X)
if(XData.shape[0]<=k and XData.shape[0]!=0):
        print("XData size:",XData.shape[0])
        k=XData.shape[0]//2
        print("K:",k)
        if(k<=0):
            return result

The changed code is de duplicated by using set

XData = np.array(list(set(X)))#2022.3.22 zph comes with a de-duplication effect
if(XData.shape[0]<=k and XData.shape[0]!=0):
        print("XData size:",XData.shape[0])
        k=XData.shape[0]//2
        print("K:",k)
        if(k<=0):
            return result

The above is hereby recorded for reference by those who have the same problems.

[Solved] Arcpy: RuntimeError: ERROR 999998: Unexpected Error.

Summarize the reasons why individuals encounter such errors when using arcpy to batch process raster data:

1. Because the supporting python of ArcGIS is 2.7, sometimes the file name is read in some hexadecimal codes with many slashes, resulting in the wrong naming of the output file name and unable to output

Solution: carefully check whether the input and output file names are correct

2. There are many files with different suffixes (for example, raster data also has files with .DBF suffix) in addition to the files that can be seen in ArcMap, so it is inevitable to make mistakes when reading in and reading out some suffix files in batch processing.

Solution: when batch processing, sort out the folders in advance, and put all kinds of or similar data together. Don’t mix them.

ERROR conda.core.link:_execute(699): An error occurred while installing package ‘‘Rolling back trans

Problem description

CONDA install the package error: ERROR conda.core.link:_execute(699): An error occurred while installing package ‘conda-forge::cudatoolkit-11.1.1-h6406543_8’. Rolling back transaction: done [Errno 12] Cannot allocate memory ()
similar errors will also be encountered during PIP installation: SystemError: deallocated bytearray object has exported buffers


Solution:

Clean up CONDA cache

conda clean -a

Opentelemetry + Jaeger Python Version Cross Service Call Example

Opentelemetry Python version cross service invocation example

When calling opentelemetry across services, you need to import opentelemetry-instrumentation-requests, and then use request to cross service requests. (note that aiohttp-client should be used if it is asynchronous)
I use Jaeger on the server, which is deployed directly through the docker of all-in-one. The code is as follows:

docker run -d --name jaeger \
  -e COLLECTOR_ZIPKIN_HOST_PORT=:9411 \
  -p 5775:5775/udp \
  -p 6831:6831/udp \
  -p 6832:6832/udp \
  -p 5778:5778 \
  -p 16686:16686 \
  -p 14250:14250 \
  -p 14268:14268 \
  -p 14269:14269 \
  -p 9411:9411 \
  jaegertracing/all-in-one:1.32

After starting Jaeger, visit the following page: http://localhost:16686

Python needs to start two services to demonstrate cross service invocation. The framework I use is fastapi, so I need to install opentelemetry-instrumentation-fastapi
call service 1 by service 2
Service 1:

import fastapi
from opentelemetry import trace
from opentelemetry.instrumentation.fastapi import FastAPIInstrumentor
from fastapi import Body
from pybase.lib.tracer.jaeger_ import register_to_jaeger
from pydantic import BaseModel

app = fastapi.FastAPI()


class UserInfo(BaseModel):
    name: str


tracer = trace.get_tracer(__name__)


@app.post("/server")
async def server(userinfo: str = Body(...), name: str = Body(..., )):
    return {"message": f"hello {userinfo},{name}"}


FastAPIInstrumentor.instrument_app(app)
if __name__ == '__main__':
    register_to_jaeger("fastapi-jaeger-server", "localhost")
    import uvicorn

    uvicorn.run(app,port=8001)

Service 2

import fastapi
import requests
from opentelemetry import trace
from opentelemetry.instrumentation.fastapi import FastAPIInstrumentor
from fastapi import Body
from opentelemetry.instrumentation.requests import RequestsInstrumentor
RequestsInstrumentor().instrument()
from pybase.lib.tracer.jaeger_ import register_to_jaeger
from pydantic import BaseModel

app = fastapi.FastAPI()


class UserInfo(BaseModel):
    name: str


tracer = trace.get_tracer(__name__)


@app.post("/foobar")
async def foobar(userinfo: str = Body(...), name: str = Body(..., )):
    with tracer.start_as_current_span("foo"):
        with tracer.start_as_current_span("bar"):
            with tracer.start_as_current_span("baz"):
                print("Hello world from OpenTelemetry Python!")
    return {"message": f"hello {userinfo},{name}"}
@app.post("/foobar2")
async def foobar2(userinfo: str = Body(...), name: str = Body(..., )):
    return {"message": f"hello {userinfo},{name}"}

@app.post("/client")
def client(userinfo: str = Body(...), name: str = Body(..., )):

    res=requests.post("http://127.0.0.1:8001/server",json={
        "userinfo":userinfo,"name":name
    })
    return res.json()


FastAPIInstrumentor.instrument_app(app)
if __name__ == '__main__':
    register_to_jaeger("fastapi-jaeger", "localhost")
    import uvicorn

    uvicorn.run(app)

A function that depends on register_ to_ jaeger:

from opentelemetry import trace
from opentelemetry.exporter.jaeger.thrift import JaegerExporter
from opentelemetry.sdk.resources import SERVICE_NAME, Resource
from opentelemetry.sdk.trace import TracerProvider
from opentelemetry.sdk.trace.export import BatchSpanProcessor


def register_to_jaeger(service_name: str, jaeger_host: str, jaeger_port: int = 6831):
    """
    Register the service to jaeger so that tracer-related information can be sent to the jaeger server
    Args:
        service_name: the registered service name
        jaeger_host: jaeger address
        jaeger_port:

    Returns: TracerProvider

    """
    provider = TracerProvider(
        resource=Resource.create({SERVICE_NAME: service_name})
    )
    trace.set_tracer_provider(
        provider
    )

    # create a JaegerExporter
    jaeger_exporter = JaegerExporter(
        agent_host_name=jaeger_host,
        agent_port=jaeger_port,
    )

    # Create a BatchSpanProcessor and add the exporter to it
    span_processor = BatchSpanProcessor(jaeger_exporter)

    # add to the tracer
    trace.get_tracer_provider().add_span_processor(span_processor)

Then execute:

curl -X 'POST' \
  'http://127.0.0.1:8000/client' \
  -H 'accept: application/json' \
  -H 'Content-Type: application/json' \
  -d '{
  "userinfo": "string",
  "name": "string"
}'

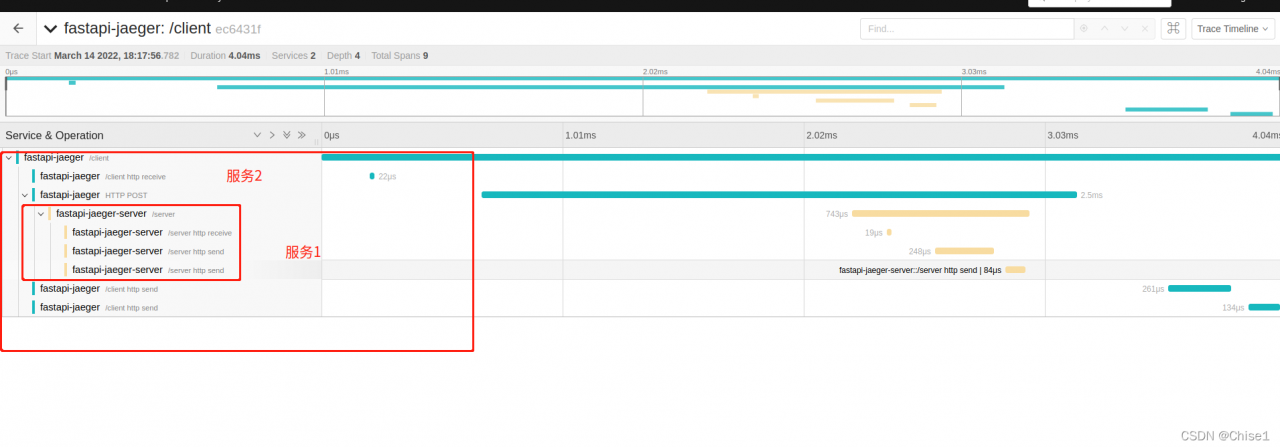
You can get the following results:
if you have any questions, please correct them.
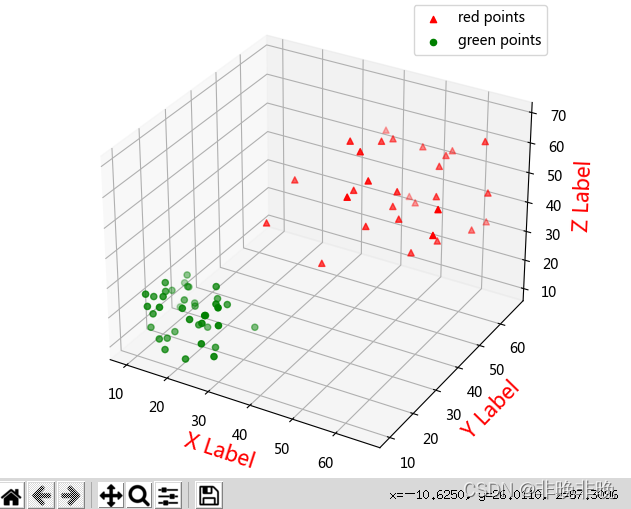
Matplotlib Draw 3D scatter Diagram Example

In the following code, it is shown that two different color scatter plots are drawn at the same time in the same coordinate system

import numpy as np
import matplotlib.pyplot as plt
from mpl_toolkits.mplot3d import Axes3D

#Generate random data
data1 = np.random.randint(30, 70, size=(30, 3)) #30*3 dimensional random integers of [30,70]
data2 = np.random.randint(10, 30, size=(40, 3)) #40*3 dimensions of [10, 30] random integers

x1 = data1[:, 0]
y1 = data1[:, 1]
z1 = data1[:, 2]

x2 = data2[:, 0]
y2 = data2[:, 1]
z2 = data2[:, 2]


# Plot a scatter plot
fig = plt.figure()
ax = Axes3D(fig)

'''
marker: shape, default round ball ('^' inverted triangle shape.)
c:color, default cyan

'''
ax.scatter(x1, y1, z1, c='r', marker = "^", label='red points')
ax.scatter(x2, y2, z2, c='g', label='green points')

# Plot the legend
ax.legend(loc='best')

# Add axes
ax.set_zlabel('Z Label', fontdict={'size': 15, 'color': 'red'}) 
ax.set_ylabel('Y Label', fontdict={'size': 15, 'color': 'red'})
ax.set_xlabel('X Label', fontdict={'size': 15, 'color': 'red'})
plt.show()

The results show that:

[Solved] Pycham Error: non zero exit code (2)

preface

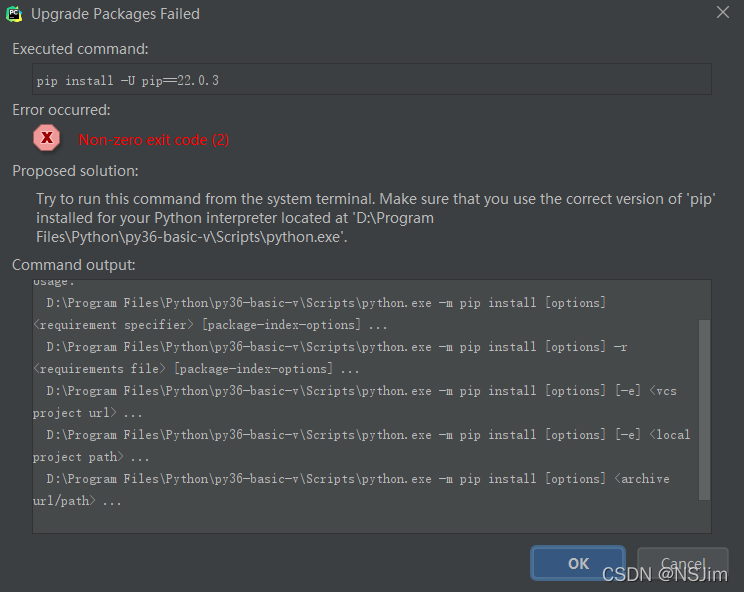
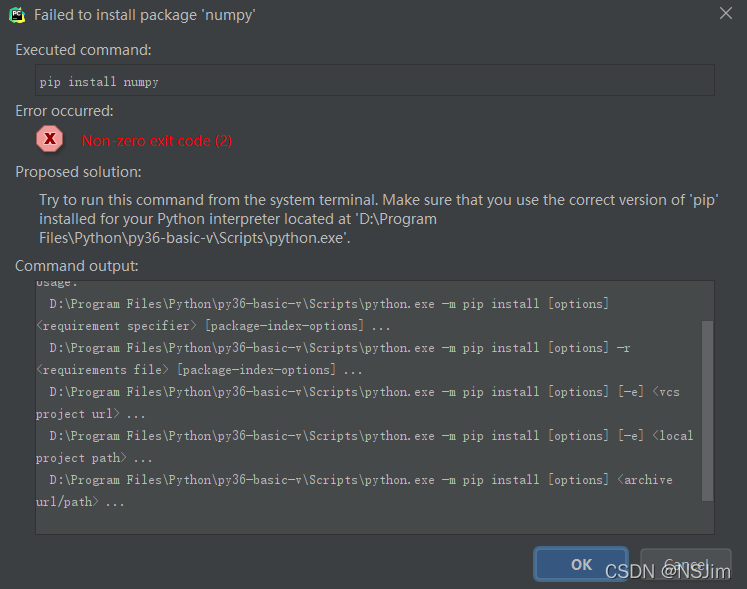
When using pycharm to install a third-party package in the python virtual environment in Python interpreter settings, it is likely to report an error: non zero exit code (2), as shown in the figure:

even upgrading pip will report an error, as shown in the figure:

Tips are as follows:

Try to run this command from the system terminal. 
Make sure that you use the correct version of 'pip' installed for your Python interpreter located at 
'D:\Program Files\Python\py36-basic-v\Scripts\python.exe'.

As above belongs, the official says the possible reason is that pip is not installed in the specified directory of the virtual environment, and suggests running the pip command in the terminal to install the third-party package.

The official hint has a certain degree of reasonableness, but it does not try all cases, you can check whether the pip module exists in the directory of the virtual environment, if it does not exist, the pip module can be installed in the specified directory; if it exists, it is not the problem of the pip module path, so what exactly is the reason?

After investigation, it is the problem of pip version, my Python version is 3.6, pip version is 21.3.1, this version of pip will definitely appear the problem, the solution is also very simple, the pip version can be downgraded to 20.2.4, operation method see the following program 2: Downgrade pip version. (It is not recommended to upgrade pip, because new versions of pip may have the same problem)

Solution 1 (recommended): install the third-party package using the terminal terminal

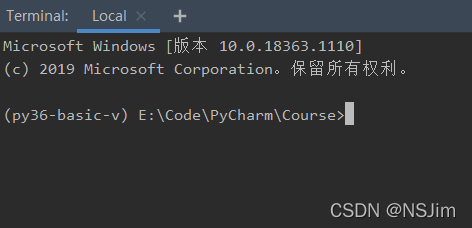
Click Terminal at the bottom of pycharm toolbar , as shown in the following figure:

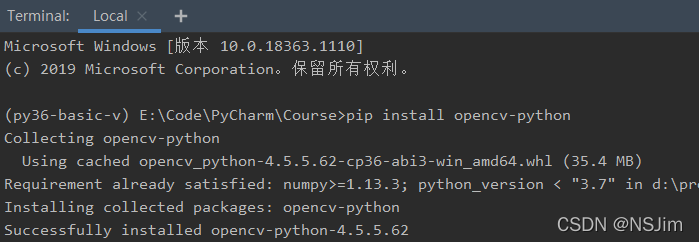
enter the PIP install command to install the third-party package, as shown in the figure:

But this solution treats the symptom but not the root cause, the problem is not solved, only the installation of third-party packages by alternative methods, if you want to solve the problem at all, please see solution 2 below.

Solution 2 (fundamental solution): downgrade the PIP version

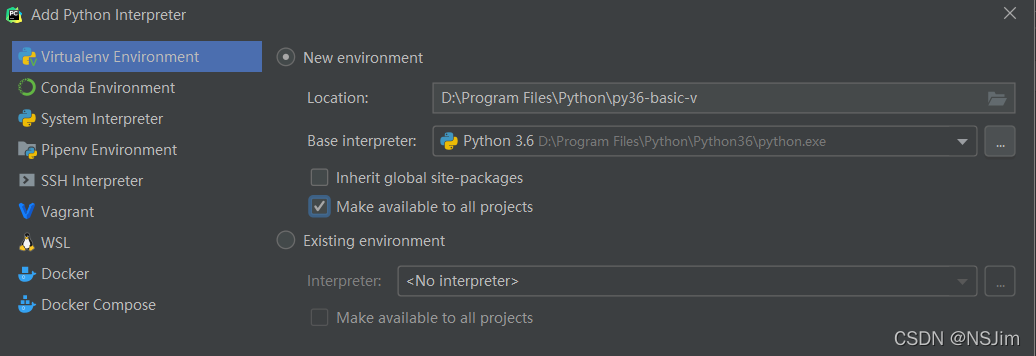
First, open a project using pycharm. If there is no Python environment, you need to create a virtual environment first, as shown in the following figure:

In file - Settings - Python interpreter, we can see that the version of PIP in Python virtual environment is 21.3.1. As shown in the figure below, we need to downgrade the version of Pip to 20.2.4

Click Terminal on the toolbar at the bottom of pychart, as shown in the following figure:

enter the following command. Note that there must be Python -m, otherwise there is no permission:

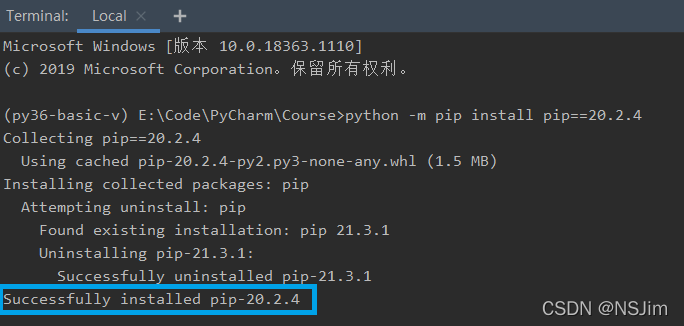
python -m pip install pip==20.2.4

After entering the command, the following prompt appears to prove that the downgrade is successful:

enter the command PIP - V to view the current PIP version, as shown in the following figure:

the problem has been successfully solved so far. The third-party package can be successfully installed in Settings, as shown in the following figure:

[Solved] Decision tree error: Graphviz’s executables not found

Decision tree code

from sklearn.datasets import load_iris
import pydotplus
from IPython.display import Image
from sklearn import tree
#Training Model
iris=load_iris()
clf=tree.DecisionTreeClassifier()
clf=clf.fit(iris.data,iris.target)

#Drawing
dot_data=tree.export_graphviz(decision_tree=clf,
                              out_file=None,
                              rounded=True,
                              filled=True,
                              feature_names=iris.feature_names)
graph=pydotplus.graph_from_dot_data(dot_data)
Image(graph.create_png())

Installation

Install pydotplus

pip install pydotplus

Running error: graphviz’s executables not found

Installing graphviz

pip install graphviz

Graphviz’s executables not found

After consulting the data, graphviz belongs to an independent software, which needs to be downloaded and installed on the official website

Website: http://www.graphviz.org/Download

Add environment variable

There are two methods, and the second one is recommended for personal test

Method 1: add the path of graphviz’s bin directory in environment variable.

Method 2: OS method

CMD

python

Enter Python environment

imoprt os
os.environ["PATH"]+= os.pathsep+"C:/Program Files/Graphviz/bin"  # change to your path of Graphviz

Done!

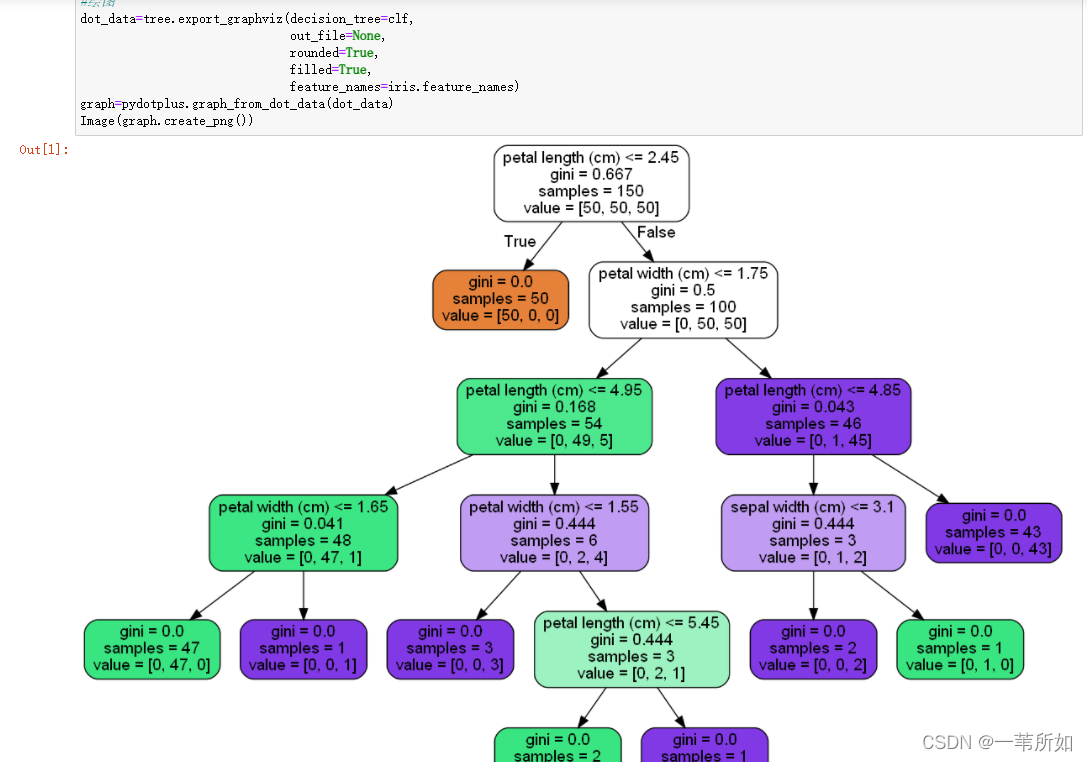
Operation results

If it is used in jupyter notebook like me, you need to restart jupyter notebook

How to Solve ModuleNotFoundError Error After pip-autoremove Installed

The pip-autoremove tool is very convenient for managing the dependencies in the environment, when uninstalling a Package, you can uninstall it together with the dependencies installed at that time. However, after version 0.10.0, using pip-autoremove will report an error:

pip-autoremove packege_name
> ModuleNotFoundError: No module named 'pip_autoremove'

This is because in this version, pip-autoremove is treated as a Module. now there is a new commit on github that fixes this problem, but at the moment the direct installation via pip still does not work. In this case, you can force the installation of the fixed version to solve the problem.

pip3 install --force git+https://github.com/imba-tjd/pip-autoremove@ups

[Solved] matplotlib.units.ConversionError: Failed to convert value(s) to axis units: ‘LiR‘


solve the problem


No handles with labels found to put in legend.

Traceback (most recent call last):
  File "D:\ProgramData\Anaconda3\lib\site-packages\matplotlib\backends\backend_qt5.py", line 508, in _draw_idle
    self.draw()
  File "D:\ProgramData\Anaconda3\lib\site-packages\matplotlib\backends\backend_agg.py", line 388, in draw
    self.figure.draw(self.renderer)
  File "D:\ProgramData\Anaconda3\lib\site-packages\matplotlib\artist.py", line 38, in draw_wrapper
    return draw(artist, renderer, *args, **kwargs)
  File "D:\ProgramData\Anaconda3\lib\site-packages\matplotlib\figure.py", line 1709, in draw
    renderer, self, artists, self.suppressComposite)
  File "D:\ProgramData\Anaconda3\lib\site-packages\matplotlib\image.py", line 135, in _draw_list_compositing_images
    a.draw(renderer)
  File "D:\ProgramData\Anaconda3\lib\site-packages\matplotlib\artist.py", line 38, in draw_wrapper
    return draw(artist, renderer, *args, **kwargs)
  File "D:\ProgramData\Anaconda3\lib\site-packages\matplotlib\axes\_base.py", line 2647, in draw
    mimage._draw_list_compositing_images(renderer, self, artists)
  File "D:\ProgramData\Anaconda3\lib\site-packages\matplotlib\image.py", line 135, in _draw_list_compositing_images
    a.draw(renderer)
  File "D:\ProgramData\Anaconda3\lib\site-packages\matplotlib\artist.py", line 38, in draw_wrapper
    return draw(artist, renderer, *args, **kwargs)
  File "D:\ProgramData\Anaconda3\lib\site-packages\matplotlib\text.py", line 670, in draw
    bbox, info, descent = textobj._get_layout(renderer)
  File "D:\ProgramData\Anaconda3\lib\site-packages\matplotlib\text.py", line 276, in _get_layout
    key = self.get_prop_tup(renderer=renderer)
  File "D:\ProgramData\Anaconda3\lib\site-packages\matplotlib\text.py", line 831, in get_prop_tup
    x, y = self.get_unitless_position()
  File "D:\ProgramData\Anaconda3\lib\site-packages\matplotlib\text.py", line 813, in get_unitless_position
    x = float(self.convert_xunits(self._x))
  File "D:\ProgramData\Anaconda3\lib\site-packages\matplotlib\artist.py", line 180, in convert_xunits
    return ax.xaxis.convert_units(x)
  File "D:\ProgramData\Anaconda3\lib\site-packages\matplotlib\axis.py", line 1553, in convert_units
    f'units: {x!r}') from e
matplotlib.units.ConversionError: Failed to convert value(s) to axis units: 'LiR'
Traceback (most recent call last):
  File "D:\ProgramData\Anaconda3\lib\site-packages\matplotlib\axis.py", line 1550, in convert_units
    ret = self.converter.convert(x, self.units, self)
  File "D:\ProgramData\Anaconda3\lib\site-packages\matplotlib\category.py", line 52, in convert
    'Missing category information for StrCategoryConverter; '
ValueError: Missing category information for StrCategoryConverter; this might be caused by unintendedly mixing categorical and numeric data
The above exception was the direct cause of the following exception:
Traceback (most recent call last):
  File "D:\ProgramData\Anaconda3\lib\site-packages\matplotlib\backends\backend_qt5.py", line 508, in _draw_idle
    self.draw()
  File "D:\ProgramData\Anaconda3\lib\site-packages\matplotlib\backends\backend_agg.py", line 388, in draw
    self.figure.draw(self.renderer)
  File "D:\ProgramData\Anaconda3\lib\site-packages\matplotlib\artist.py", line 38, in draw_wrapper
    return draw(artist, renderer, *args, **kwargs)
  File "D:\ProgramData\Anaconda3\lib\site-packages\matplotlib\figure.py", line 1709, in draw
    renderer, self, artists, self.suppressComposite)
  File "D:\ProgramData\Anaconda3\lib\site-packages\matplotlib\image.py", line 135, in _draw_list_compositing_images
    a.draw(renderer)
  File "D:\ProgramData\Anaconda3\lib\site-packages\matplotlib\artist.py", line 38, in draw_wrapper
    return draw(artist, renderer, *args, **kwargs)
  File "D:\ProgramData\Anaconda3\lib\site-packages\matplotlib\axes\_base.py", line 2647, in draw
    mimage._draw_list_compositing_images(renderer, self, artists)
  File "D:\ProgramData\Anaconda3\lib\site-packages\matplotlib\image.py", line 135, in _draw_list_compositing_images
    a.draw(renderer)
  File "D:\ProgramData\Anaconda3\lib\site-packages\matplotlib\artist.py", line 38, in draw_wrapper
    return draw(artist, renderer, *args, **kwargs)
  File "D:\ProgramData\Anaconda3\lib\site-packages\matplotlib\text.py", line 670, in draw
    bbox, info, descent = textobj._get_layout(renderer)
  File "D:\ProgramData\Anaconda3\lib\site-packages\matplotlib\text.py", line 276, in _get_layout
    key = self.get_prop_tup(renderer=renderer)
  File "D:\ProgramData\Anaconda3\lib\site-packages\matplotlib\text.py", line 831, in get_prop_tup
    x, y = self.get_unitless_position()
  File "D:\ProgramData\Anaconda3\lib\site-packages\matplotlib\text.py", line 813, in get_unitless_position
    x = float(self.convert_xunits(self._x))
  File "D:\ProgramData\Anaconda3\lib\site-packages\matplotlib\artist.py", line 180, in convert_xunits
    return ax.xaxis.convert_units(x)
  File "D:\ProgramData\Anaconda3\lib\site-packages\matplotlib\axis.py", line 1553, in convert_units
    f'units: {x!r}') from e
matplotlib.units.ConversionError: Failed to convert value(s) to axis units: 'LiR'

Error:
matplotlib.units.Conversion error: failed to convert value to axis unit: ‘LiR’

Solution:
matplotlib version is low, update the matplotlib library to version 3.3.2 or higher!