Tag Archives: project

[Solved] ByteTrack Error: ModuleNotFoundError: No module named ‘yolox’

1. Error Message:

File "tools/demo_track.py", line 10, in <module>
from yolox.data.data_augment import preproc
ModuleNotFoundError: No module named 'yolox'

2. Reason

Although the yolox folder exists under the project file, it cannot be called without the yolox library installed.

3. Solution
3.1 Answer from the original author

First of, please make sure you decide for a version of CUDA and consistently use that; I am using 11.3 in this.
I fixed this and many other installation and compilation errors, by uninstalling and re-installing the following programs in the exact order

  1. Clone the yolox repo and unzip it
  2. Install Virtual Studio 2019 Community (https://visualstudio.microsoft.com/downloads/)
  3. Download CUDA https://developer.nvidia.com/cuda-11.3.0-download-archive (I just did express installation)
  4. Get https://docs.conda.io/en/latest/miniconda.html for your version of python
  5. Install pytorch with cuda enabled conda install pytorch torchvision cudatoolkit=11.3 -c pytorch
  6. Navigate conda to the download directory (cd yolox_path) of yolox and type in:
    pip install -r requirements.txt
    pip install pycocotools # this should get added to requirements.txt @FateScript
    pip install -v -e . # or python setup.py develop
  7. Congratulations you fixed the error, now you’ll be able to run yolox as described in Quick Start > Demo (example: python tools/demo.py video -n yolox-s -c /path/to/your/yolox_s.pth –path /path/to/your/video –conf 0.25 –nms 0.45 –tsize 640 –save_result –device [cpu/gpu] )

A couple notices:

  • You can at the time of writing this; not install above CUDA 11.3, because conda does not provide a higher version in sources to compile with pytorch
  • You can not install a higher version of Virtual Studio, because of incompability with CUDA (devs did not add support for MSVS22 yet)
  • You’re forced to install MSVS; because this repo depends on it, to be able to compile as written in step 6.
  • You can not simply uninstall conda, because it removes its CUDA compiled pytorch version and that in return breaks yolox. But I think you could most likely avoid this

In short you kept getting this error, because you couldn’t compile yolox properly or not at all.

3.2 Summary

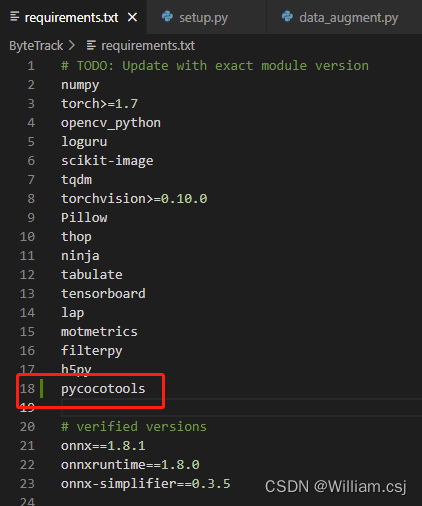
Add pycocotools in requirements.txt as below:

Run pip install -r requirements.txt

Run pip install -v -e . Or python setup.py develop command
The result after running.
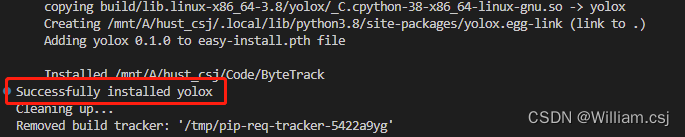

Run Successfully!


Reference:

    ModuleNotFoundError: No module named ‘yolox’ ??how can i resolve it ?please!

[Solved] SyntaxError: Invalid regular expression: invalid group specifier name

SyntaxError: Invalid regular expression: invalid group specifier name

Regular problem

SafariSyntaxError: Invalid regular expression: invalid group specification name
FirefoxSyntaxError: invalid regexp group
Mobile terminal: Android is normal, iOS is not

reason

Firefox, IE, and IOS do not support the following writing methods: ?<=, ?<!, ?!, ?=

Look ahead is a kind of conditional judgment, such as if statement
(?=exp) the position that satisfies expression exp after positive look ahead match
(?!exp) the position that does not satisfy expression exp after negative look ahead match

Solution:

let reg = /ab?<=cd/
Modify to
let reg = new RegExp('ab(?<=cd)')

error: RPC failed; curl 92 HTTP/2 stream 0 was not closed cleanly: CANCEL (err 8)

When uploading code to GitHub using git, the following error occurs:

It is true that there is a large amount of code uploaded at one time, and then expand the post buffer according to the scheme provided on the Internet, but it has no effect here. Maybe the buffer is not large enough, HHH. You can try this plan first.

git config http.postBuffer 524288000

Then, if it has not been solved, try the following scheme. We can see that the error message refers to http/2, so the solution is to switch back to http1 upload. After uploading, switch back to http2.

$ git config --global http.version HTTP/1.1
After it push was ok and I have changed HTTP version to 2 again:
$ git config --global http.version HTTP/2

However, things were always so bad, so I tried to switch to SSH connection.

git remote set-url origin [email protected]:{username}/{repository name}.git

However

Looking at this line of red and yellow characters, I knew early in the morning that the file was too large, but the above methods didn’t work here. Fortunately, GIT LFS was mentioned in the error prompt. OK, Download git LFS.

For Mac users:

brew install git-lfs

  Then, under the project directory, execute:

git lfs install

Then, use git LFS to track the format of the large file you want to upload. What I upload here is in Bin format, so execute:

git lfs track "*.bin"

Then make sure  . Gitattributes tracked to

git add .gitattributes

Then upload it

Solution of “do not use ‘new’ for side effects” for eslint verification of Vue project

When I was writing Vue project, I wrote the following code in JS to report an error

import Vue from 'vue'
import App from './App.vue'

new Vue({
  el: '#app',
  component: {
    App
  },
  template: '<App/>'
})

Solution:

1. Define a variable XXX to accept the created Vue, and then add XXX to use

import Vue from 'vue'
import App from './App.vue'

let myOwn = new Vue({
  el: '#app',
  component: {
    App
  },
  template: '<App/>'
})
Vue.use ({ xxx })

2. Add a comment line above the new Vue so that eslint does not check for ‘no new’

import Vue from 'vue'
import App from './App.vue'

/* eslint-disable no-new */
new Vue({
  el: '#app',
  component: {
    App
  },
  template: '<App/>'
})


What did project > clean do in eclipse

It felt like something, but I just forgot. Picture is truth, look at the answers on stack overflow.


So this step removes the class files that have been compiled in the project and recompiles them. That’s all. What’s the difference between
and build all, since eclipse builds on
The time stamp
Of the judgment mechanism. So when you press build all some classes that eclipse thinks the timestamp hasn’t changed won’t be recompiled.
I’m sure you know the difference between Clean and Build All.

Error: unable to resolve dependency for… Could not resolve project

changed some things of the project two days ago. After submitting, I found that the compiler always reported errors, but the packaging was ok. Error message is as follows:

ERROR: Unable to resolve the dependency for ‘: XXX @ debugProduction/compileClasspath’ : Could not resolve project: yyy.
Show Details
Affected Modules: XXX

where ‘XXX’ and ‘yyy’ are the two modules in my project. I looked for many ways on the Internet, but I couldn’t solve them.
later went back to the last change and found that I had changed build.gradle for module x, but not for module y, and the configuration of buildTypes for the two modules was inconsistent.

so the obvious solution is to copy the configuration of buildTypes in build.gradle of module x into build.gradle of module y.

does not have to be copied exactly, only has to be configured in the same format as the two modules . My error was caused by the buildTypes in Module X, which added the configuration of the releaseTest mode, but not in Module Y.

Python+ Pandas + Evaluation of Music Equipment over the years (Notes)

from the point of view of the title, this lesson is supposed to explore how something changes over time. Therefore, the core content should be to explore the changing trend of time series data. Details are as follows:

1. Fetch data

data source: http://jmcauley.ucsd.edu/data/amazon/links.html

amazon e-commerce website, provides some data resources, the data on the above page is from May 1996 to July 2014, more than 20 years of product reviews. Ratings only data header “user, item, rating, timestamp”
we download “himself Instruments” comments in the file. (the data download is very slow, almost to the time of day), the teacher can use the downloaded file: time analysis/https://www.njcie.com/python/2
2. Processing data

1, read data

[script]

rnames = ['uid', 'pid', 'rating', 'timestamp']
ratings = pd.read_csv('D:\\ratings_Musical_Instruments.csv', header=None, names=rnames)

2. Processing time stamp

[script]

ratings['date'] = ratings['timestamp'].apply(datetime.fromtimestamp)
ratings['year'] = ratings['date'].dt.year
ratings['month'] = ratings['date'].dt.month
ratings= ratings['date'].to_period(freq='M')
print(ratings)

[result]
date uid pid rating timestamp year month
2014-03 A1YS9MDZP93857 00028320 3.0 1394496000 2014 3
2013-06 A3TS466QBAWB9D 0014072149 5.0 1370476800 2013 6
[description]

  1. time stamp is an integer, 1970-01-01 00:00:00 to the number of seconds of statistical time.
  2. datetime. Fromtimestamp () converts timestamp data to datetime data
  3. . Note that the datatime data is converted to period data by specifying the index column and assigning the converted dataframe to a DF variable. Namely: ratings ratings of = [‘ date ‘] to_period (freq = “M”)
    Analysis data

    1. Mean score of each month

    [script 1]

    pingFen = ratings['rating'].groupby('date').mean()
    plt.plot(pingFen)
    plt.show()
    

    [script 2]

    pingFen = ratings['rating'].groupby('date').mean()
    plt.plot(pingFen.to_timestamp())
    plt.show()
    

    TypeError: float() argument must be a string or a number, not ‘Period’. TypeError: float() argument must be a string or a number, not ‘Period’. TypeError: float() argument must be a string or a number, not ‘Period’, TypeError: TypeError: float() argument must be a string or a number, not ‘Period’.

    script 2 results as follows:

    [description]
    1) this does not indicate the score for which item, but only the overall score for the “musical instrument” product.
    2) it can be seen that the score of Musical Instruments tends to be stable after 2004, and shows a downward trend from 1998 to 2004.

    2. The number of participants per month

    because the above results seem to ignore one factor, which is the number of participants in the scoring. In extreme cases, the fewer participants, the more unstable the scoring and the worse the representation. Let’s take a look at the number of ratings:
    [script]

    pingFenR = ratings['rating'].groupby('date').count()
    plt.plot(pingFenR.to_timestamp())
    plt.show()
    

    【 results 】

    From the figure, we can see that before 2010, the number of participants was very small, but after 2010, the number of participants increased rapidly, so in analysis 1, the mean score after 2010 was more stable, which can also be said that the data at this stage is more meaningful.

    3. Combined with the effective number of scores in each period, the score was observed

    , then how to present the data of three dimensions in the same graph, including time, number of participants and mean score?
    scatter plot with size!
    [script]

    pingFen = ratings[['rating']].groupby('date').agg(['count', 'mean'])
    plt.scatter(pingFen.index.to_timestamp(),pingFen['rating']['mean'], ingFen['rating']['count'])
    plt.show()
    

    【 results 】

    【 description 】
     contrast PLT. Scatter (“) and (PLT) the plot (), the period index into the timestamp, the different?
    plt.plot() : pingfn.to_timestamp ()
    plt.scatter() : pingfn.index. To_timestamp () :
    plt.scatter() : pingfn.index. To_timestamp () :
    ; == I don’t know about this point, anyone who knows can leave a message ~ ==

    4. Adjust the image display effect

    1) resize (enlarge or shrink)

    sometimes we show little difference in the size of the scatter, so we can adjust it by multiplying or dividing the parameter of the size of the point by a value.
    for example: in the graph I formed above, some points are too big. The way to turn them down is as follows:

    plt.scatter(pingFen.index.to_timestamp(), pingFen['rating']['mean'], pingFen['rating']['count']/100)
    

    results are as follows:

    2) resize (normalized)

    maps all data to between 0 and 1, using (n-min)/(max-min).
    I tried the following script and got the wrong result
    (pingFen['count'] -pingfen ['count']. Min () /(pingFen['count']. Max ())
    KeyError: ‘count’
    the reason is that there is no field in this rating table (pingFen) called ‘count’, count is just an algorithm.
    solution is as follows:

    pingFen = ratings.groupby('date').agg(cnt=('rating', 'count'), avg =('rating', 'mean'))
    pingFen['sl'] = (pingFen['cnt']-pingFen['cnt'].min())/(pingFen['cnt'].max())
    

    and I’m going to talk specifically about the agg() function here, and it’s going to take me a lot of work to understand it.
    “about pandas in the agg (instructions) 】

    3) color

    parameter details, see https://www.jb51.net/article/127806.htm
    here I use the script as follows:

    ratings = ratings.to_period(freq='M')
    pingFen = ratings.groupby('date').agg(cnt=('rating', 'count'), avg =('rating', 'mean'))
    pingFen['sl'] = (pingFen['cnt']-pingFen['cnt'].min())/(pingFen['cnt'].max())
    plt.scatter(pingFen.index.to_timestamp(), pingFen['avg'], s=pingFen['sl']*1500, c=pingFen['cnt']/pingFen['cnt'].mean(), alpha=0.3)
    

    to scatter () interpretation is as follows:

    after the adjustment effect below, this is my dream JingTu, although is not the best,

    【 description 】
     figure in x axis as the time
     y for scoring average, as can be seen from the graph, after 2006, scoring average concentration between 4.1 to 4.5
     point of capital for the number of participation grade, can be seen from the diagram after 2012, the number of raters broad and the number of scores before 2004, so its score more valuable
     color representation of the information can be configured, because this case without introducing too much observation data dimensions, I still use the grading number to display color here, Purple is small, yellow is large, and green is in the middle.

    [end]