implementation:
when variable points are dense, use the tag to draw the graph, the graph will be very strange.
this method generates a specified number of tags and draws the legend accurately.
The essence of drawing is to draw lines, draw lines first, then generate a specified number of markers, set symbols for drawing markers, and finally draw legend, display legend.
implementation code is as follows :
clear;
clc;
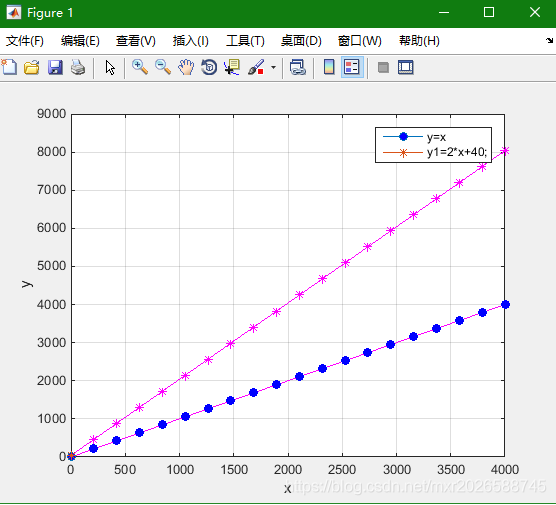
x = 1:1:4000;
y=x;
figure(1);
N=20;
k=round(linspace(1,size(x,2),N));%自变量范围内产生20个数值
plot(x,y,'m-');%实际曲线
grid on;
hold on;
h0=plot(x(k),y(k),'bo','MarkerFaceColor','b');%标记
f1=plot(x(1),y(1),'o-','MarkerFaceColor','b');%图例用图
% legend(f1,'DDIBFO');
hold on;
y1=2*x+40;
ploRead More:
- VBA “user defined type not defined” MSXML2.DOMDocument
- User defined height of layeui carousel
- Origin — draw the curve with error bar
- [resolved] superset failed to create admin user: error! User already exists user or attributeerror: ‘nonetype’‘
- When C language refers to a user-defined type as a parameter, an error segmentation fault is reported
- User defined profile in vscode settings.json And default configuration defaultSettings.json
- Realization of springboot authorization verification technology based on JWT
- Realization of breakpoint download based on DIO in flutter
- User CF itemcf collaborative filtering algorithm based on user and item
- Vscode cannot write user settings. Open user settings, clear errors or warnings, and then type again
- Matlab draw logarithmic coordinates!
- Add Samba user prompt failed to add entry for user
- Add samba user prompt Failed to add entry for user.
- Visual slam Lesson 6: curve fitting with g2o, error: cmake error at CMakeList.txt (find_ package) By not providing“FindG2O.cmake“
- What are the common clearing commands in MATLAB?
- The usage of several integer functions in MATLAB (fix, floor, ceil, round)
- Matlab: Three forms of random number generated (Rand, Randi and Randn)
- Matlab im show squeeze
- The difference of four kinds of integer function (fix floor ceil round) in MATLAB
- Matlab prompt error