This share is mainly about the possible guesses, positioning and solutions to performance-related problems that we often encounter in interviews. During the interview, I found that many students did not have a clear idea
The purpose and objectives of this course
• Common causes of high SERVER IO
• Methods of locating common problems
= = to a common cause of high IO the server = = = = = = = = = = = = = = = = = = = = = = = = = = = = = = = = = = = = = = = = = = = = = = = = = = = = = = = = = = = = = = = = = = = = = = = = =
Summary: Disks are usually the slowest subsystem of a computer and the most prone to performance bottlenecks because disks are the farthest from the CPU and CPU access to disks involves mechanical operations such as shaft rotation, track seeking, and so on.
If the occupancy of IO is too high, the following considerations can be made:
1) First consider writing too much log content (or heavy traffic)
1) Whether the content printed in the log is reasonable
Front-end application server. Avoid frequent local logging or abnormal logging
2) Whether the log level is reasonable
3] Consider asynchronous log writing (generally can solve CPU sawtooth fluctuation). In order to reduce disk IO operation, log writing is like memory partition; However, the log volume is so large that it is easy to fill the memory, and then consider compressing the log.
2) Full disk (phenomenon during pressure measurement: TPS decreases and response time increases)
1】 To find the disk full of large files, reasonable deletion, it is best to have a regular cleaning script, can be cleaned regularly
2】 To expand the disk space disk capacity
3] If it is difficult to clean, read and write on the main hard disk, and the basic data is moved to the mounted hard disk regularly.
3) The number of database connections is over limited, resulting in too much sleep and too many sleep tasks:
1】 Every time the program connected to the database, remember to close the database.
2) Or, in the mysql configuration file, set the mysql timeout wait_timout, which defaults to eight hours and is set to a lower level
4) The database IO is too high and the amount of query is large, so it can be read/write separation (increase the read library) or library branch operation to reduce disk pressure, and some buffer parameters can be adjusted to reduce the IO write frequency
5) High disk IO is caused by reading and writing files
1】 Raid can be used to reduce stress
6) Insufficient performance of the disk itself
1) Consider replacing a new disk (one with strong performance)
Common positioning problem = = = = = = = = = = = = = = = = = = = = = = = = = = = = = = = = = = = = = = = = = = = = = = = = = = = = = = = = = = = = = = = = = = = =
The Linux system has a performance problem, and we can generally use the commands top, iostat, iotop, free, vmstat, and so on to see the initial location problem.
Today we’re going to talk about iostat and IOtop, the general steps for locating a problem:
Iostat is a command that gives us a wealth of IO status data. We usually start with iostat to see if there is a performance bottleneck
Step-2 use IOTOP to find IO high process
1. Common usage of Iostat:
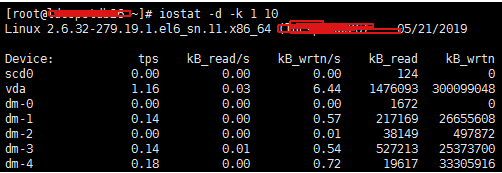
Iostat -D-K 1 10 # to view TPS and throughput information
Parameter -d indicates that the device (disk) is in use;
-k Some columns that use blocks force Kilobytes to use units;
1, 10 means that the data display is refreshed once every 1 second, showing a total of 10 times
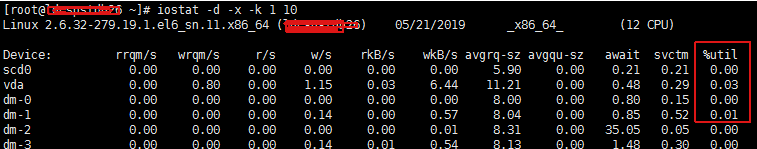
Iostat -d-x-k 1 10 # View device utilization (%util), response time (await)
We can get more statistics using the -x parameter.
note: generally %util is greater than 70%, and the I/O pressure is relatively high, indicating that there are too many I/O requests generated, the I/O system is full load, and there may be a bottleneck on the disk. The disk may have a bottleneck.
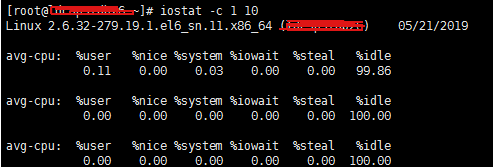
Iostat can also be used to get partial CPU state values:
Iostat -c 1 10 # to see the CPU status
Note that IDLE has a higher pressure when it is less than 70% IO, and there is more wait for the general reading speed.
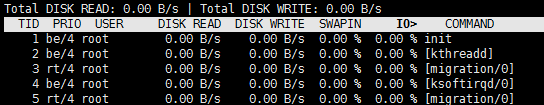
2. We can basically determine whether there is a bottleneck of IO through the common command of iostat above, and then we can use the iotop command to catch the culprit process. Here, it is relatively simple to directly enter the command and execute it (generally, Java process is caught, mySQld is caught, more problems are more)
The purpose and objectives of this course
• Common causes of high SERVER IO
• Methods of locating common problems
= = to a common cause of high IO the server = = = = = = = = = = = = = = = = = = = = = = = = = = = = = = = = = = = = = = = = = = = = = = = = = = = = = = = = = = = = = = = = = = = = = = = = =
Summary: Disks are usually the slowest subsystem of a computer and the most prone to performance bottlenecks because disks are the farthest from the CPU and CPU access to disks involves mechanical operations such as shaft rotation, track seeking, and so on.
If the occupancy of IO is too high, the following considerations can be made:
1) First consider writing too much log content (or heavy traffic)
1) Whether the content printed in the log is reasonable
Front-end application server. Avoid frequent local logging or abnormal logging
2) Whether the log level is reasonable
3] Consider asynchronous log writing (generally can solve CPU sawtooth fluctuation). In order to reduce disk IO operation, log writing is like memory partition; However, the log volume is so large that it is easy to fill the memory, and then consider compressing the log.
2) Full disk (phenomenon during pressure measurement: TPS decreases and response time increases)
1】 To find the disk full of large files, reasonable deletion, it is best to have a regular cleaning script, can be cleaned regularly
2】 To expand the disk space disk capacity
3] If it is difficult to clean, read and write on the main hard disk, and the basic data is moved to the mounted hard disk regularly.
3) The number of database connections is over limited, resulting in too much sleep and too many sleep tasks:
1】 Every time the program connected to the database, remember to close the database.
2) Or, in the mysql configuration file, set the mysql timeout wait_timout, which defaults to eight hours and is set to a lower level
4) The database IO is too high and the amount of query is large, so it can be read/write separation (increase the read library) or library branch operation to reduce disk pressure, and some buffer parameters can be adjusted to reduce the IO write frequency
5) High disk IO is caused by reading and writing files
1】 Raid can be used to reduce stress
6) Insufficient performance of the disk itself
1) Consider replacing a new disk (one with strong performance)
Common positioning problem = = = = = = = = = = = = = = = = = = = = = = = = = = = = = = = = = = = = = = = = = = = = = = = = = = = = = = = = = = = = = = = = = = = =
The Linux system has a performance problem, and we can generally use the commands top, iostat, iotop, free, vmstat, and so on to see the initial location problem.
Today we’re going to talk about iostat and IOtop, the general steps for locating a problem:
Iostat is a command that gives us a wealth of IO status data. We usually start with iostat to see if there is a performance bottleneck
Step-2 use IOTOP to find IO high process
1. Common usage of Iostat:
Iostat -D-K 1 10 # to view TPS and throughput information
Parameter -d indicates that the device (disk) is in use;
-k Some columns that use blocks force Kilobytes to use units;
1, 10 means that the data display is refreshed once every 1 second, showing a total of 10 times
Iostat -d-x-k 1 10 # View device utilization (%util), response time (await)
We can get more statistics using the -x parameter.
note: generally %util is greater than 70%, and the I/O pressure is relatively high, indicating that there are too many I/O requests generated, the I/O system is full load, and there may be a bottleneck on the disk. The disk may have a bottleneck.
Iostat can also be used to get partial CPU state values:
Iostat -c 1 10 # to see the CPU status
Note that IDLE has a higher pressure when it is less than 70% IO, and there is more wait for the general reading speed.
2. We can basically determine whether there is a bottleneck of IO through the common command of iostat above, and then we can use the iotop command to catch the culprit process. Here, it is relatively simple to directly enter the command and execute it (generally, Java process is caught, mySQld is caught, more problems are more)
Read More:
- Bitmap optimization and memory optimization
- Solve the problem that the version of less is too high
- Optimization method of vs2017 starting speed
- C language problem: 0xc0000005: access conflict occurred when writing to location 0xffffcc.
- Listview remembers location not itme location
- Error from server (alreadyexists) clusterrolebindings.rbac.authorization .k8s.io “kubelet
- When installing oracle12c, the problem of “unable to check whether the specified location is on CFS” appears
- Solr 4.0 SolrException: Error opening new searcher java.io.FileNotFoundException problem solution
- Solve the problem caused by: java.sql.SQLRecoverableException : IO error: connection reset related problems
- Start gzip in node environment of project optimization
- Ubuntu reads the shared folder under windows Unable to mount location Failed to retrieve share list from server
- 【Error】gRPC failure=Status{code=UNAVAILABLE, description=io exception, cause=io.netty.channel.
- Optimization and upgrade solution for one click deployment without Jenkins under Linux
- Eclipse automatic prompt setting method and optimization
- Python conversion hex to string, high and low data processing
- Java connection zookeeper high availability hive error
- How to use high version OpenGL under Windows
- High precision addition function template
- How does lightningchart, a high performance chart control, draw maps in 3D?
- Version problem of SQL Server