Install
./configure
make
make install
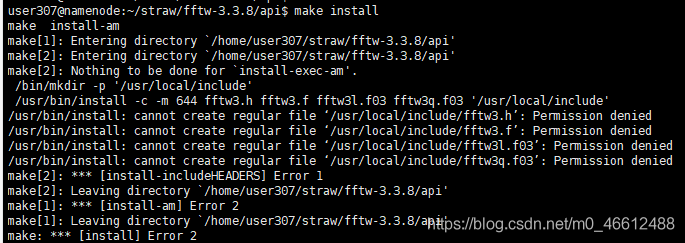
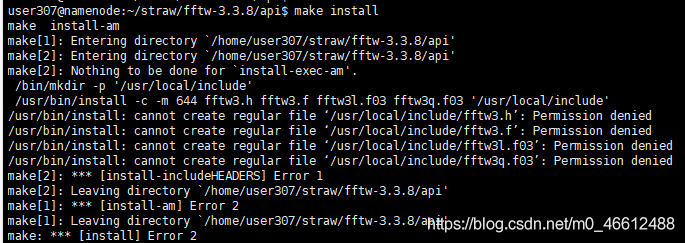
make[3]: *** [install-includeheaders] Error 1 make[3]: Leaving directory ‘/home/user307/straw/fftw-3.3.8/ API’
After checking the information and entering/API directory to make install
, a permission denied error occurs.
Methods of modifying index and columns names by dataframe in pandas
Dataframe.index = [newName], dataframe.columns = [newName]. Dataframe.columns = [newName].
, use the rename method (recommended) :
dataframe.rename (mapper = None, index = None, axis = None, copy = True, inplace = False, level = None)
mapper, index, level = None) You can use any of them, such as combining index and Columns. Index and column are passed directly into mapper or dictionary form.
axis: int or STR, used with mapper. These can be axis names (‘ index ‘, ‘columns’) or Numbers (0,1). The default is’ index ‘.
copy: Boolean, which defaults to True, whether to copy the underlying data.
inplace: Boolean value, default to False, whether to return a new DataFrame. If True, the copy value is ignored.
import numpy as np
import pandas as pd
from pandas import Series, DataFrame

df1 = DataFrame(np.arange(9).reshape(3, 3), index = ['bj', 'sh', 'gz'], columns=['a', 'b', 'c'])
print(df1)
'''
    a  b  c
bj  0  1  2
sh  3  4  5
gz  6  7  8
'''

# Modify the index of df1
print(df1.index) # You can print out the print value and also assign a value to it.
df1.index = Series(['beijing', 'shanghai', 'guangzhou'])
print(df1)
'''
           a  b  c
beijing    0  1  2
shanghai   3  4  5
guangzhou  6  7  8
'''

# You can use the map method for mapping, which is almost identical to the map in python.
print(df1.index.map(str.upper)) # Index(['BEIJING', 'SHANGHAI', 'GUANGZHOU'], dtype='object')

print(df1) # The result does not change, it just returns a dataframe instead.
'''
           a  b  c
beijing    0  1  2
shanghai   3  4  5
guangzhou  6  7  8
'''

# If it needs to be changed, it can be as follows: Assign another value to a variable
df1.index = df1.index.map(str.upper)
print(df1) # This changes the
'''
           a  b  c
BEIJING    0  1  2
SHANGHAI   3  4  5
GUANGZHOU  6  7  8
'''

# A faster method uses rename, which you can specify values for index and column respectively.
# Assign a value using the map method
df2 = df1.rename(index=str.lower, columns=str.upper) # This method also generates a new dataframe
print(df2)
''' can be easily modified. dataframe 的 index 和 columns
           A  B  C
beijing    0  1  2
shanghai   3  4  5
guangzhou  6  7  8
'''

# At the same time, rename can also be passed into the dictionary
df3 = df2.rename(index={'beijing':'bj'}, columns = {'A':'aa'}) # Change the name for an index separately
print(df3) #
'''
           aa  B  C
bj          0  1  2
shanghai    3  4  5
guangzhou   6  7  8
'''

# Custom map functions
def test_map(x):
    return x+'_ABC'

print(df1.index.map(test_map))
# output Index(['BEIJING_ABC', 'SHANGHAI_ABC', 'GUANGZHOU_ABC'], dtype='object')

print(df1.rename(index=test_map))
'''
               a  b  c
BEIJING_ABC    0  1  2
SHANGHAI_ABC   3  4  5
GUANGZHOU_ABC  6  7  8
'''
Navicat premium essentials for Mac database settings
Navicat Premium Essentials for MAC is the most professional database management software available on the MAC platform. It allows you to connect to MySQL, MariaDB, MongoDB, SQL Server, Oracle, PostgreSQL, and SQLite databases from a single application. Navicat Premium 12 allows you to create, manage, and maintain databases quickly and easily. Now let’s take a look at Navicat Premium Essentials for MAC Database Settings.  [dl]15-532[/dl]
database Settings
MySQL, Oracle, PostgreSQL, SQL Server, MariaDB, MongoDB
in the database TAB, you can set which databases appear in the navigation pane when connecting to the Server. This setting is not mandatory. To set custom database Settings, check The Use Custom Database List. Then, check the database to display from the Name column. If Navicat automatically opens the database when you want to connect, check the Auto Open box.
add a hidden database to the list
click the “+” button.
enter the database name.
check the newly added database in the database list.
removes a database from the list
selects a database from the list of databases.
click “-” button.
[note] the database will only be removed from the database list, it will still exist on the server.
SQLite
in the database TAB, you can attach a SQLite database file to the connection. Click the “+” button and enter information:
option description
database name enter the database name displayed by Navicat.
database file selects the database file path. If the database file is encrypted, check this option and provide a “password”.
to separate a database, select from the list and click the “-” button.
Stix / taxii Threat Intelligence Analysis 2 (working mode)

How to use STIX for Automated Sharing and Graphing of Cyber Threat Data
This article does not intend to carry out translation operation, only focuses on the main points and my personal views. The article is the clearest I have read recently, or the one I can understand best…
STIX Overview
STIX itself is a set of XML schemas which together comprise a language for describing cyber threat information in a standardized manner. This is important because cyber threat sharing currently occurs manually between trusted parties; with a standardized way of describing the data, automated threat sharing becomes possible. For this purpose MITRE has also developed TAXII to share STIX data over HTTP and HTTPS.
The concept of STIx/TAXII was proposed out of the existence of sharing. Threat intelligence varies from agency to agency, and if you want to share it, you have to have a set of standards that everyone can understand. On the other hand, the establishment of standards is conducive to the completion of machine-read, automatic analysis and storage . In general, standards are proposed for two purposes, much like protocols:
- Shared computer automation operation
If stix is regarded as a data structure, taxii is the transmission mode of these bombs. On haliataxii.com, only HTTP is transmitted, but this is only a demo test. Therefore, for security, taxii must be the world of HTTPS .
STIX Benefits
STIX can be used to characterize indicators, TTPs, exploit targets, and other aspects of a cyber threat. STIX takes advantage of another MITRE schema, CybOX, to represent Observables, and can be extended to utilize existing schemas, such as CAPEC or OpenIOC.
In STIX’s data structure, Obsevables USES CybOX to describe the appearance characteristics. But not the same as stix==Cybox. Different threat intelligence protocols need to be able to be converted, and many open source tools are also provided on github.
In fact, a lot of times, data processing USES json, which is concise and efficient. However, as for intelligence analysis, sometimes the data description is very complex, and using json is counterproductive, while XML has an advantage.
For more advanced applications, the framework corresponding to python, such as python-stix, is often used to describe the intelligence content, and the framework automatically completes the storage in XML format. If the user needs to interpret, use the corresponding method to read the data from the file. This avoids the complexity of manipulating XML manually.
STIX can also be converted to HTML with the use of an XSLT transform
All in all, the stix standard has been supported by the MITRE organization, as can be seen from the number of open source tools available on github. However, these frameworks are confirmatory demos, and the enterprise has a long way to go if it wants to implement them.
STIX Example
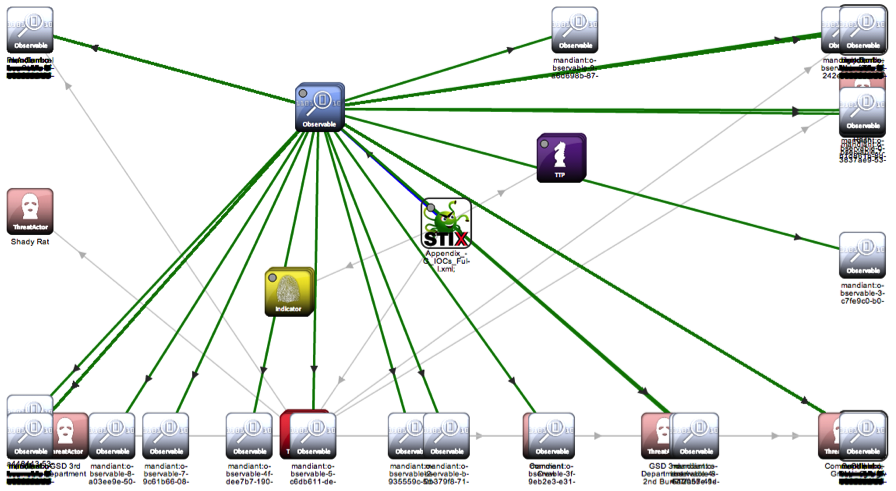
The figure above is implemented using stix-viz. The emergence of this tool is also inevitable. From the current trend, the emergence of visualization is necessary to help people interpret. The program exists on Github and is currently easy to install and ready to run with the JRE configured. Here is a joke, the author’s graph structure is not really good.
In my opinion, stix-viz is only the prototype at present, and there are many inconveniences in the operation process. For example, the text in the HTML version is too small and there are few options. But the visualization requirement is basically done.
STIX and Recorded Future
Give this title Recorded Future thumb up.
documenting the future is what all security threat intelligence is about.
By managing information security threat indicators in structured formats, like STIX, defenders can automate the process of finding connections between internal incidents and external sources. This can work bidirectionally: searching Recorded Future for more context around internally observed indicators, or testing trending indicators from open source reporting against internal datasets.
By analyzing the signs of threat, the threat harm can be avoided or mitigated. How do you do correlation analysis, that’s what stix does.
Look for signs from the inside, such as whether such behavior has occurred in the past, etc. Check with external threat intelligence to see if such information is available and if it is recorded in the knowledge base. Once the processing is complete, if it is a new threat, the intelligence needs to be eventually documented and Shared.
The full coverage of the control system of TG pro
In some cases, it may be necessary to fully cover the system fan controls and use custom algorithms. You can use TG Pro by combining the power of the Auto Boost rule with the power of the overlay system. Keep in mind that when fan mode is set to Auto Boost, this completely replaces system fan control. If the fan speed is set too low, the system will not be able to increase or decrease the fan speed, causing the Mac to overheat. While this can be a very powerful feature, use at your own risk.

TG Pro Tutorial
To do this, first enable coverage for all fans. Depending on the Mac model you have, it will look like this:
for 2018 and 2019 Mac models (with T2 chips) 
Applicable to all other Mac models 
Now that TG Pro is fully covered, the Auto Boost rule must be added to increase fan speed as the temperature rises. This is very similar to the “Multiple automatic enhancement rule” section, but a rule must start at 0-100% of the maximum RPM (note: 0% is the minimum RPM). Otherwise, the fan will never be able to increase to its maximum speed, which is needed at very high temperatures.
here is a set of example rules:
fan speed is always at least 10%
if any sensor temperature is above 40°C,
fan speed will be 25%?If any sensor temperature is above 50 °C, the fan speed will be 50%
the fan speed will be 75% if any sensor temperature is above 60 °C
if any sensor temperature is above 70 °C, the fan speed will be 100%
The rules can vary, depending on whether the Mac is running on a battery or plugged in
To enable this feature, change the fan control mode to Auto Boost and TG Pro will adjust the fan speed to exactly how to set it according to the Auto Boost rule of the current power supply! 
The above is the way to completely cover the system with TG Pro’s custom control function. Again, it should be emphasized that although this may be a very powerful function, use at your own risk!
Debian install sublime text 3
Step 1: unzip tar.gz file
step 2: add the unzip folder to /opt
cp-r source file target folder
step 3: add soft link
ln-s /opt/subime (actual folder) /sublime_text /usr/bin/sublime
Sublime opens by typing it on the command line
Sublime Text 2 steps are the same
Modifying the default style of scrollbar in Android
Well, I met the requirement again, and needed to modify the style of ScrollBar, so I looked up a lot of documents, I think the summary of this great cow is good, by the way, I took a look at his home page, wow, great ~!! Attach great god article links: http://likfe.com/archives/
knowledge points in the ListView/ScrollView/RecyclerView add attributes:
android: vertical scrollbars = “”
android: scrollbarTrackVertical =” @ drawable/xxx_vertical_track “
android: scrollbarThumbVertical =” @ drawable/xxx_vertical_thumb “
B: Horizontal scroll bar
android: horizontal scrollbars = “”
android: scrollbarTrackHorizontal =” @ drawable/xxx_horizontal_track “
android: scrollbarThumbHorizontal =” @ drawable/xxx_horizontal_thum “
other common attributes
defines the style and position of the scrollbar
android:scrollbarStyle= “outsideInset”
2. Define the size of the scroll bar, refers to the width, when the vertical level refers to the height of the
android: dp scrollbarSilbarSize = “4”
| attributes | effects | ||||||||||
|---|---|---|---|---|---|---|---|---|---|---|---|
| 1 scrollbarThumbVertical[Horizontal] | 3 short bars | ||||||||||
| 7 scrollbarTrackVertical[Horizontal] | 9 long bars, The background Note that where scrollbaTrackxxx, scrollbarThumbxxx can use: ◦ custom Shape ◦ ◦. ◦ can be registered for use.9. PNG @color/ XXX to use color values You cannot use the # XXXXXX color value directly Android :scrollbarStyle can define the style and position of the scrollbar with four optional values including insideOverlay, insideInset, outsideOverlay and outsideInset. Where inside and outside respectively mean whether the overlay is inside the padding of the view, overlay and inset mean whether the overlay is on the view or inserted behind the view, so the four values respectively represent:
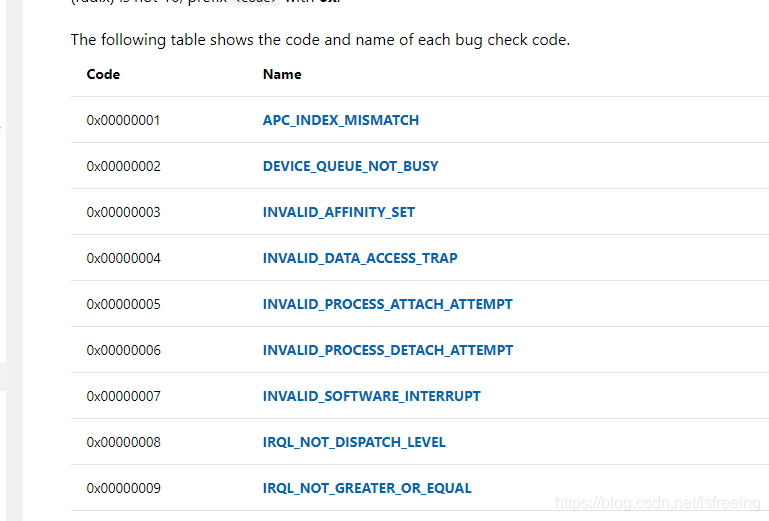
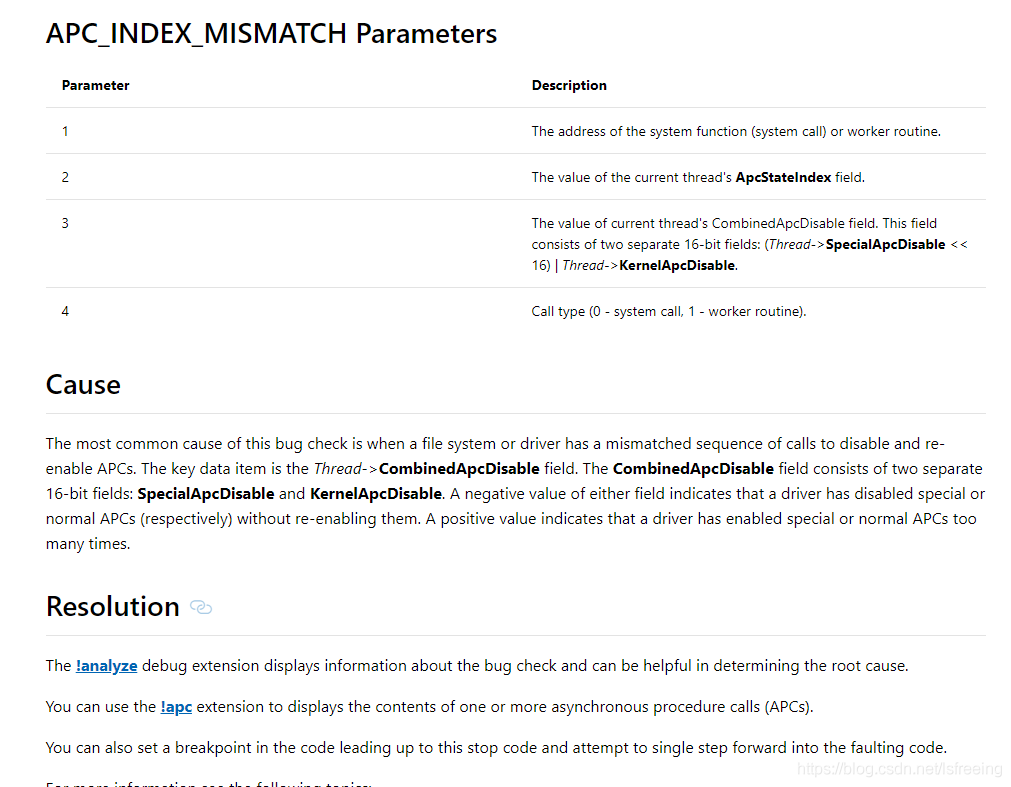
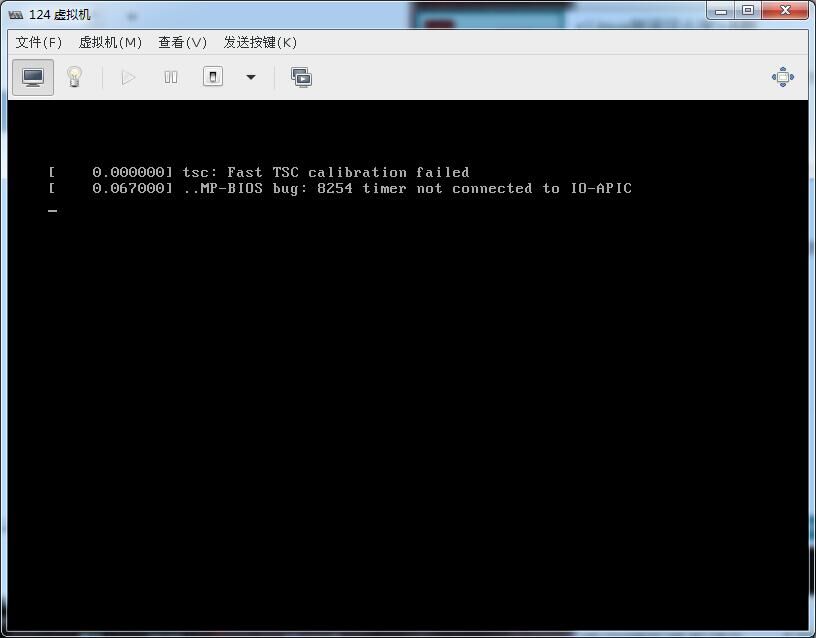
Demo Demo 2 default: [LeetCode] – 125. The Valid Palindrome Use isLetter to determine if it is a letter Results: First of all, given the kernel printing information, the serial port will have some, Don’t worry about the kernel version number on the stack, because switching to a 3.16.44 kernel will also cause this problem. Any surprise to find that The above Contact: [email protected]
https://cwiki.apache.org/confluence/display/RANGER/Install+and+Configure+Solr+for+Ranger+Audits+-+Apache+Ranger+0.5 KVM inside boot error prompt: |