Tag Archives: Operation and maintenance

Nginx front end and back end separation + service cluster reverse proxy

1. Scene

Nginx implements the separation of front and back end, and the reverse proxy of service cluster.

2. Nginx configuration instance

upstream portal-system {
       server 127.0.0.1:8061 max_fails=3 fail_timeout=30s;
       server 172.31.88.30:8061 max_fails=3 fail_timeout=30s;
}

server {
        listen       80;
        server_name  47.102.168.177;
        root /opt/pages/dispatch-portal-system/;

       location/{
         proxy_set_header Host $host:$server_port;
         proxy_pass   http://portal-system;
       }

       location /images/ {
         alias  /opt/images/dispatch-portal-system/;
       }
       
       location /favicon.ico {
         root /opt/images/dispatch-portal-system/;
       }
       
       location /api/user/updateImage/ {
          proxy_set_header Host $host:$server_port;
          proxy_pass   http://127.0.0.1:8061/;
       }

       location   =/{
          root /opt/pages/dispatch-portal-system/;
          add_header Cache-Control "no-cache, no-store";
       }
	   
        location /index.html {
          root  /opt/pages/dispatch-portal-system/;
          add_header Cache-Control "no-cache, no-store";
        }

        location /static/ {
          root  /opt/pages/dispatch-portal-system/;
        }

}


NxL job cluster nginx routing forwarding and reverse proxy

1. Scene

Two servers are deployed with XXL job respectively to build a high availability cluster

Provide easy request URL

2. Nginx configuration

 upstream xxl-jobs {
        server 192.168.30.01:9500 max_fails=3 fail_timeout=30s;
        server 192.168.30.02:9500 max_fails=3 fail_timeout=30s;
    }

     server {
        listen    8888;
        server_name  localhost;
        location/{
            proxy_pass http://xxl-jobs;
            index  index.html index.htm;
        }
        error_page   500 502 503 504  /50x.html;
        location = /50x.html {
            root   html;
        }
    }


Update project manually_ Solution of too large jar package in springboot

1. Problem scenario

Project update, upload the entire jar package, too large, resulting in long upload time, update or upgrade too slow.

2. Solutions

1) Store jars that are not updated frequently in a separate folder LIBS.

2) Frequently updated jars are typed as one jar.

3、 pom.xml to configure

1) The final jar package contains the updated jar package

2) Folder LIBS kicks out jars that are often updated

<build>
        <plugins>
            <plugin>
                <groupId>org.apache.maven.plugins</groupId>
                <artifactId>maven-source-plugin</artifactId>
            </plugin>
            <plugin>
                <groupId>org.apache.maven.plugins</groupId>
                <artifactId>maven-jar-plugin</artifactId>
            </plugin>
            <plugin>
                <groupId>org.apache.maven.plugins</groupId>
                <artifactId>maven-dependency-plugin</artifactId>
                <executions>
                    <execution>
                        <id>copy-dependencies</id>
                        <phase>prepare-package</phase>
                        <goals>
                            <goal>copy-dependencies</goal>
                        </goals>
                        <configuration>
                            <outputDirectory>${project.build.directory}/libs</outputDirectory>
                            <overWriteIfNewer>true</overWriteIfNewer>
                            <includeScope>runtime</includeScope>
                            <excludeGroupIds>com.mp,com.mp.common.spring,com.mp.common.util</excludeGroupIds>
                        </configuration>
                    </execution>
                </executions>
            </plugin>
            <plugin>
                <groupId>org.springframework.boot</groupId>
                <artifactId>spring-boot-maven-plugin</artifactId>
                <configuration>
                    <layout>ZIP</layout>
                    <includes>
                        <include>
                            <groupId>com.mp</groupId>
                            <artifactId>mp-dispatch-service-api</artifactId>
                        </include>
                        <include>
                            <groupId>com.mp.common.spring</groupId>
                            <artifactId>common-spring-jpa</artifactId>
                        </include>
                        <include>
                            <groupId>com.mp.common.spring</groupId>
                            <artifactId>common-spring-base</artifactId>
                        </include>
                        <include>
                            <groupId>com.mp.common.util</groupId>
                            <artifactId>common-util</artifactId>
                        </include>
                    </includes>
                </configuration>
                <executions>
                    <execution>
                        <goals>
                            <goal>repackage</goal>
                            <goal>build-info</goal>
                        </goals>
                    </execution>
                </executions>
            </plugin>
            <plugin>
                <groupId>org.apache.maven.plugins</groupId>
                <artifactId>maven-surefire-plugin</artifactId>
                <configuration>
                    <skip>true</skip>
                </configuration>
            </plugin>
        </plugins>
    </build>


Log separation using tool cronlog

Foreword: Tomcat log is cut by date

Using cronolog to segment the image of tomcat9 catalina.out Log; Tomcat’s catalina.out The log file cannot be divided by date. All the log files are output and written to a single file catalina.out In this way, the. Out log will become larger and larger, and the cost of operation and maintenance will increase. To archive log files by date, cronolog can be used to realize log segmentation.

1. Step 1: cronlog installation

Use the yum command to install cronlog

yum install cronolog

2. Step 2: modify catalina.sh Documents

Directory: Tomcat/bin/ catalina.sh

Original setting:

After modification:

shift
 # touch "$CATALINA_OUT"
  if [ "$1" = "-security" ] ; then
    if [ $have_tty -eq 1 ]; then
      echo "Using Security Manager"
    fi
    shift
    eval $_NOHUP "\"$_RUNJAVA\"" "\"$LOGGING_CONFIG\"" $LOGGING_MANAGER $JAVA_OPTS $CATALINA_OPTS \
      -D$ENDORSED_PROP="\"$JAVA_ENDORSED_DIRS\"" \
      -classpath "\"$CLASSPATH\"" \
      -Djava.security.manager \
      -Djava.security.policy=="\"$CATALINA_BASE/conf/catalina.policy\"" \
      -Dcatalina.base="\"$CATALINA_BASE\"" \
      -Dcatalina.home="\"$CATALINA_HOME\"" \
      -Djava.io.tmpdir="\"$CATALINA_TMPDIR\"" \
      org.apache.catalina.startup.Bootstrap "$@" start \
      2&>&1 | /usr/local/sbin/cronolog "$CATALINA_BASE/logs/catalina-%Y-%m-%d.out" &

  else
    eval $_NOHUP "\"$_RUNJAVA\"" "\"$LOGGING_CONFIG\"" $LOGGING_MANAGER $JAVA_OPTS $CATALINA_OPTS \
      -D$ENDORSED_PROP="\"$JAVA_ENDORSED_DIRS\"" \
      -classpath "\"$CLASSPATH\"" \
      -Dcatalina.base="\"$CATALINA_BASE\"" \
      -Dcatalina.home="\"$CATALINA_HOME\"" \
      -Djava.io.tmpdir="\"$CATALINA_TMPDIR\"" \
      org.apache.catalina.startup.Bootstrap "$@" start \
      2&>&1 | /usr/local/sbin/cronolog "$CATALINA_BASE/logs/catalina-%Y-%m-%d.out" &

  fi

3. Step 3: restart Tomcat

Restart Tomcat and the log will take effect according to the date. A screenshot of the log file is shown below.


New version of grafana add data source error!

Premise:

There are no errors in the data source URL configured by grafana.


Phenomenon:

1) After upgrading grafana, it is found that the original configured open face data source is invalid, and HTTP error not found is always prompted.

2) After installing the new version of grafana, we found that ZABBIX data source configuration always reported an error, could not connect to given URL.


handle:

1) Re install the version under grafana 5.4.

2) Check the configuration of ZABBIX user name and password.


The specific reasons and how to configure them above grafana 5.4 have not been studied yet.

Reproduced in: https://www.cnblogs.com/whych/p/10793709.html

Error in ODBC connection of Dameng database, [ISQL] error: could not SQLConnect

In the process of learning Dameng database, install ODBC driver process record.
Operating system environment: Qilin 6.0 server

1. UNIX ODBC installation
tar – xzvf UNIX odbc-2.3.0 tar.gz
CD unixodbc-2.3.0
./configure — enable GUI = no
make
make install
all the way down OK, there are two configuration files for ODBC configuration ODBC.ini and odbcinst.ini By default, you can log in and edit in/usr/local/etc
root user, as shown in the figure:


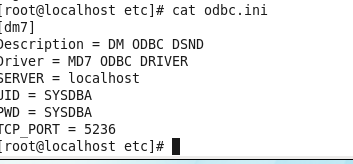
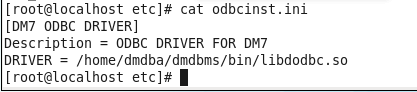
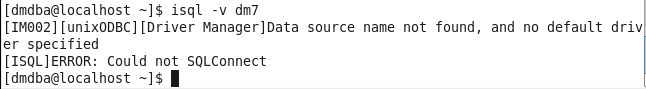
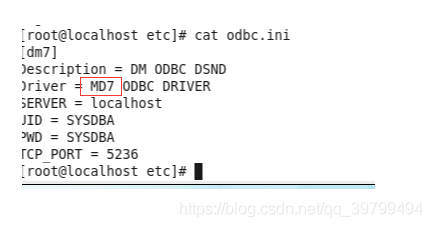
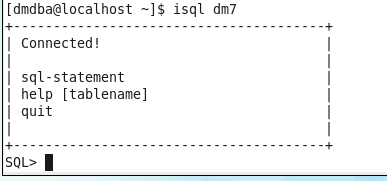
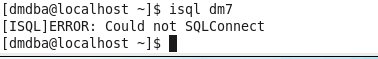
3. Test the ODBC connection
Su – dmdba
execute ISQL Dm7
report an error, [ISQL] error: could not SQLConnect

in order to see the cause of the error, execute ISQL – V Dm7, prompt:

according to the cause of the error, guess that there is an error in the configuration file. After careful inspection, it is found that:

after the problem is solved, execute ISQL Dm7, the correct result comes out:

Wamp Apache can’t run error report could not execute menu item

wamp:could not Execute menu item (internal error) [exception] count not perform service action: the server did not respond to the start or control request in time

At present, there are basically two other types on the Internet: the port number is occupied and the file cannot be found

This problem is hardly found on the Internet

Only Apache can’t start, the error is shown in the figure.
Solution: start manually in the service.
Start the service: services.msc

Start the wampaache service manually

ZABBIX server startup error resolution

The following error is reported when starting ZABBIX server:

29171:20180714:084911.367 cannot start alert manager service: Cannot bind socket to "/var/run/zabbix/zabbix_server_alerter.sock": [13] Permission denied.
29142:20180714:084911.368 One child process died (PID:29171,exitcode/signal:1). Exiting ...
29225:20180714:084923.611 cannot start preprocessing service: Cannot bind socket to "/var/run/zabbix/zabbix_server_preprocessing.sock": [13] Permission denied.
 29213:20180714:084923.613 server #18 started [poller #2]
 29195:20180714:084923.614 One child process died (PID:29225,exitcode/signal:1). Exiting ...
 29195:20180714:084925.615 syncing history data...
 29195:20180714:084925.615 syncing history data done
 29195:20180714:084925.615 syncing trend data...
 29195:20180714:084925.615 syncing trend data done
 29195:20180714:084925.615 Zabbix Server stopped. Zabbix 3.4.10 (revision 81503).

The above is just a partial error log pasted.
The above reason is that SELinux starts
sestatus

SELinux status:                 enabled
SELinuxfs mount:                /sys/fs/selinux
SELinux root directory:         /etc/selinux
Loaded policy name:             targeted
Current mode:                   enforcing
Mode from config file:          disabled
Policy MLS status:              enabled
Policy deny_unknown status:     allowed
Max kernel policy version:      28

The solution is as follows:
VIM/etc/SELinux/config

# This file controls the state of SELinux on the system.
# SELINUX= can take one of these three values:
#     enforcing - SELinux security policy is enforced.
#     permissive - SELinux prints warnings instead of enforcing.
#     disabled - No SELinux policy is loaded.
SELINUX=disabled
# SELINUXTYPE= can take one of three two values:
#     targeted - Targeted processes are protected,
#     minimum - Modification of targeted policy. Only selected processes are protected. 
#     mls - Multi Level Security protection.
SELINUXTYPE=targeted 

Modify SELinux = disabled modify configuration file to close permanently.
setenforce 0 : temporarily shut down SELinux.
SELinux can also be set to allow ZABBIX access, which is not very troublesome, but SELinux can not be used basically. If you want to know, you can search for it by yourself. Here, I just want to make more statements.

Reproduced in: https://www.cnblogs.com/Cherry-Linux/p/9308490.html

[Error resolution] paramiko.ssh_exception.SSHException: Error reading SSH protocol banner setting

Error message
In the morning, my colleague in the data group told me that there were several programs reporting errors. After checking the log, the error message was found:

paramiko.ssh_exception.SSHException: Error reading SSH protocol banner

After a search, it was revealed that the error was caused by the banner_TIMEOUT default setting being too short, only 15s.
Error analysis
See the transport code under Paramiko library. Py:

class Transport(threading.Thread, ClosingContextManager):
        self.banner_timeout = 15
        # how long (seconds) to wait for the handshake to finish after SSH

Reset the banner_TIMEOUT property value
Most of the methods on the Internet is to modify the source code, reinstall, feel a little trouble. I’m going to reset the properties in the code.

transport = paramiko.Transport((self.host, self.port))
print(transport.banner_timeout)
transport.banner_timeout = 30
print(transport.banner_timeout)

After testing, the two printed property values are different, indicating that the property is set successfully and the problem is solved.

Reproduced in: https://www.cnblogs.com/everfight/p/paramiko_ssh_exception.html

KVM–Host does not support any virtualization…

Phenomenon: When virt-install creates a new virtual machine, prompt Host does not support any Virtualization options.
environment: CentOS7, KVM, CPU: Intel(R) Xeon(R) CPU e5-2609,
qemu-kvm, qemu-kvm-tools, virt-manager, libvirt virt-install four major components have been normally installed,
selinux has been closed, iptables have been fully released,
processing steps:
1. General step, advanced BIOS to see whether the CPU is on virtualization, confirm that
2, grep-e ‘(VMX | SVM)’ /proc/cpuinfo, check whether there is echo information, found that there is, also means that step 1 is not blind. Grep KVM
3, dmesg |, grep KVM, the actual function is the same as step 1 and step 2, confirm again whether the host supports virtualization, if not, KVM :disabled by BIOS will be displayed, here I do not have any echo. 4. At this point, the usual solutions on baidu and Google have come to an end and the problem has not been solved… Only themselves to think of a way, here a little fooling around step ten thousand steps.
5, systemctl status libvirtd suddenly found that there was an error in the libvirt log:
internal error: Failed to probe QEMU binary with QMP: /usr/libexec/ qem-kvm: relocation error: /lib64/ libspy-server. so.1
.
6, baidu learned that spice server is provided as a library for qemu use, compiled is libspice server.
, however, is a completely unknown thing to debug and debug, so let’s see if qemu- KVM has any problems.
7, ll /usr/libexec/qemu- KVM first see if qemu- KVM has execution permissions, found that there is, then normal.
8, /usr/libexec/qemu-kvm –version run manually, find error:
version libssl.so.10 not defined in file libssl.so.10
9, still get the solution through baidu solution:
/usr/libexec/qemu-kvm –version normal display version
virt-install
failure solved successfully!
/usr/libexec/qemu-kvm –version
virt-install
failure solved! Thank:

https://blog.51cto.com/506554897/1972914 http://bbs.chinaunix.net/thread-3691547-1-1.html

Reproduced in: https://blog.51cto.com/7308842/2395997

standard_init_linux.go:178: exec user process caused “no such file or directory”

Golang Docker Build runs an error after making the input
The problem arises because the environment in which you are compiling is different from the environment in which you are running, and may have dependencies on dynamic libraries
1. By default, go USES static linking and dynamic compilation is used in Docker’s Golang environment.
2. If you want to compile +alpine to deploy with docker, you can do so by disabling cgoCGO_ENABLED=0.
3. If you want to use cgo, make GCC statically compiled by go build --ldflags "-extldflags -static".


Reference: https://yryz.net/post/golang-docker-alpine-start-panic.html
 

Reproduced in: https://www.cnblogs.com/davygeek/p/10969434.html