VTK profile
Outline the characteristics of the frame structure
An overview of the Frame structure The visualization model adopts the data flow model 5In this model, each module is connected in the network, and a series of operations on the data are realized by using the module. The characteristic of this model is that it is applicable to different data types and different algorithms, so it is very flexible. VTK uses a data stream approach to convert raw information into graphical data. There are two basic objects in this method: a Data Object and a Process Object.
Copyright Notice: All posts on this blog are licensed under the CC BY-NC-SA 4.0 license, unless otherwise stated. Reprint please indicate the source!
The VTK1Visualization Toolkit) is a free, open-source software Toolkit designed and developed by Kitware based on object-oriented programming techniques for image processing, 3D graphics, and visual programming. VTK is designed as a Toolkit rather than a system. It is an independent target library, which can be easily embedded into any development tool and developed its own library functions on the basis of it, so as to build an independent large-scale application system. VTK consists of C++ class libraries and a compilation interface layer including Tcl/Tk, Java and Python. This hierarchy allows developers to develop in a tool language they are familiar with, and each of these languages has its own GUI development support.
VTK encapsulates many commonly used algorithms in the field of graphics and visualization, and shields some details often encountered in the process of visualization development, which greatly eases the vast number of researchers and developers. In terms of image processing and visualization, VTK has incomparable advantages over other software packages. As a popular image application software development platform, it is widely used in scientific research and engineering fields.
The characteristics of
VTK is a set of excellent 3D visualization graphics system, which has been widely valued and applied in recent years. It has the following distinct technical features 2
The most notable feature of VTK is the open source code, which can meet the needs of different users. Because of its open source code, many research institutions and individuals around the world use it for teaching, research and visualization system development, so that it is widely supported, prompting its code to continue to update, so it has been constantly improved and improved. VTK supports C ++, TCL, JAVA, Python and other language environments, and has a variety of programming languages between the code conversion function. VTK encapsulates many excellent 3D data visualization algorithms at present, provides comprehensive functional support, and can easily realize various operations and transformations on data sets. Users can use VTK to achieve any image processing functions, such as two-dimensional and three-dimensional graphic image visualization calculation, volume rendering, image segmentation, image registration and so on. The 3D image generated by VTK is convenient for interaction, less code writing and good code reuse. VTK can be used in both Windows and UNIX systems, with platform independence and good portability. VTK supports a wealth of data types and can process a variety of data types.
VTK adopts object-oriented design method, which includes two different object models: graphic model and visual model. The graphic model is the abstraction of the three-dimensional graph, and the visual model is the visual data flow model 3
Graphic model presents the essential characteristics of 3D graphics system, which is mainly used to display the geometric shapes of data sets as intuitive 3D graphics, and to set and operate properties such as attributes, camera, lighting, rendering window, etc., so as to realize the functions of image generation and user interaction. It can be used for 2D, 3D and other general graphics processing, it mainly has 9 basic objects 4 Attribute: Describes some characteristics of geometric objects, such as illumination characteristics, reflection intensity, gray scale of objects, drawing style of objects, coloring mode, etc., in order to achieve the rendering of three-dimensional graphics with a sense of reality. Role: Represents the drawing object entity in the rendering scene and can be scaled to the role, and the role’s position, orientation, rendering properties, references, texture mapping and other properties can be set through parameter adjustment. Transforms: A stack containing a 4×4 transformation matrix, which can be translated, scaled, rotated, etc., usually at the top of the stack. Mapping: Specifies the relationship between basic primitives and rendering data in the graphics library. Its main task is to convert data objects in the visualization process into geometric primitives. One or more roles can use the same mapping, and multiple parameters control the mapping. Camera: Used to define viewpoint position, focal point position, and other related properties, which can be set by the caller as needed. Light: it can illuminate the drawing object in the scene. The position, state, Angle, intensity and color of the light can be changed by calling parameters. It also supports point light source and parallel light source. When the characters in the scene interact with the light, they can be observed through the camera. Render controller: Creates a render window and defines a method for calculating coordinates, device-independent. Renderer: it is mainly used to control the rendering process of the target, manage the position and attributes of the light source, camera and drawing object, and provide the conversion between the observation coordinate system, display coordinate system and world coordinate system. After rendering, you need to load the renderer into the render window for display. Rendering window: is a user graphical interface, used to generate a window on the display device, you can set the size of the rendering window, produce stereo display effect, etc., multiple image renderers can draw into a single image rendering window, at the same time can also create multiple image rendering Windows.
VTK uses Pipe Line mechanism, which supports regular or irregular Point sets, images, Volume and other data types, and can easily realize the conversion between these data types. In the VTK class library, it provides flexible and rich classes for reading files of various data formats and their conversion, such as VTKBMPreader (bitmap reading class), VTKJPEGReader (JPEG image reading class) and other classes for reading images which are inheriting from VTKImageReader 6
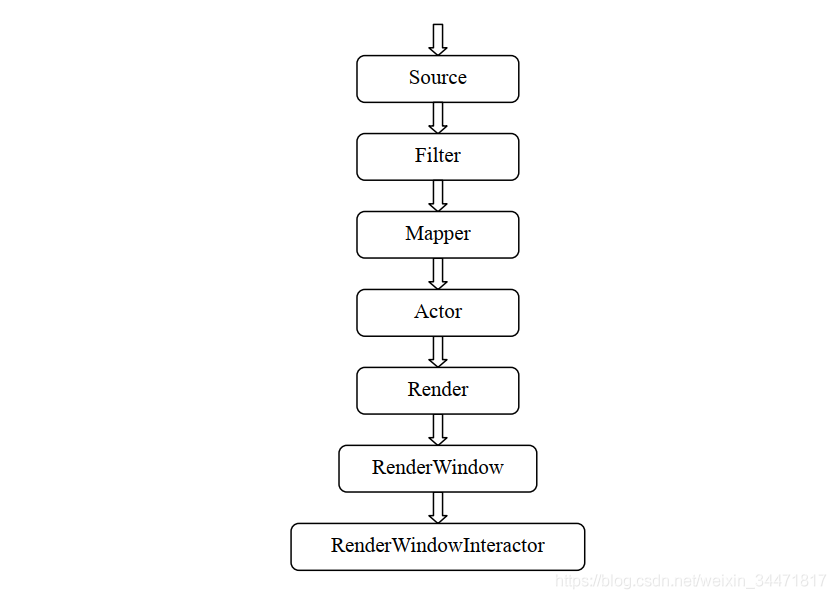
neral framework is shown in the figure. Source is the beginning of the whole pipeline. Source data is first generated by reading files and other means. Filter can have a number of data input, and can produce a number of data output, is a relatively independent calculation module, the function is to make a variety of data transformation. Mapper converts the data processed by the Filter into graph data, and realizes the mapping relationship from data to graph, which is the interface between the visualization pipeline and the graph model. Only mapping relation is obviously not enough. In order to see the real image, Actor is also needed, whose function is to materialize the mapping relation obtained by Mapper, so that people can see the final drawing result. Actor can also control the display properties of the image to make the image appear more realistic by calling the property object (VTKProperty). The next step is for Render and RenderWindow to display the image on the computer window. By calling the graphics engine they provide and the interface between the computer window system, the drawn graphics can be displayed in the window. RenderWindowInterActor is used to realize the interaction between the user and the image, so that the image can be rotated through the mouse operation, and it is convenient to observe the image from all angles.
W.J.S chroeder, K.M.M artin, W.E.L orensen, The Visualization Toolkit – An 0 bject Oriented Approach to 3 d Graphics, Prentice Hall, Upper Richard River, NJ, 1996. ↩ ︎ Shi Yu. Research and implementation of Visualization technology based on VTK [D]. Xian building university of science and technology, 2009.6. ↩ ︎ Schroeder W, Martin K, Lorensen B.T he the Visualization Toolkit an Object – oriented Approach to 3 D Graphics [M]. Prentice Hall: Kitware Inc, 2002. ↩ ︎ qing-gong xu, chang-hua li. VTK Discussion on Frame Structure and Operation Mechanism [J]. Journal of luoyang institute of technology (natural science edition), 2008, 19 (1) : 67-70. ↩ ︎ huang shanshan, wang liang, xiao-ping min. Visualization technology based on VTK studies [J]. Journal of China digital medicine, 2008, 3 (1) : 31-34. ↩ ︎ Wu Songjun, peng demobilization. Of 2 d contour line based on VTK 3 d visualization reconstruction [J]. Computer and modern, 2004, (10) : 111-113. ↩ ︎
Read More:
- VTK series: installation and introduction of VTK
- Introduction to JIRA introduction to HP ALM
- Solutions to several VTK compilation errors (vtk5.8 + VS2010)
- VTK: VTK error problem set
- Introduction to the principle of Mali tile based rendering
- Introduction to total phase data center
- Java — one of Apollo configuration centers — Introduction to Apollo
- VTK learning notes: visual model
- Brief introduction of Linux MMAP and solution of bus error
- Brief introduction of idea Lombok and solutions for reporting red and wrong
- Comparison of ITK and VTK
- Using qvtk renderwindoninteractor to load VTK widget
- [depth concept] · introduction of EER (equal error rate)
- How to solve the problem of error reporting in the introduction of Python Django no module name ‘Django. Utils. Six’
- pthread_ Introduction and application of join function
- Introduction of Hadoop HDFS and the use of basic client commands
- GoogleIO 2013 Android fast networking framework Volley introduction
- Prompt “failed to load file or assembly” when VTK uses renderwindowcontrol
- The solution to the error of “no override found for * *” in the use of VTK
- Linux use ls to view the file color is all white solution, and Linux file color introduction