turn on debugging function, modify configuration file app.conf:
EnableAdmin = true
AdminAddr = "0.0.0.0"
AdminPort = 8088
access management page: http://your IP :8088/
click on the menu: get memprof, prompt create heap profile mem-948. Memprof means memory information file was successfully generated
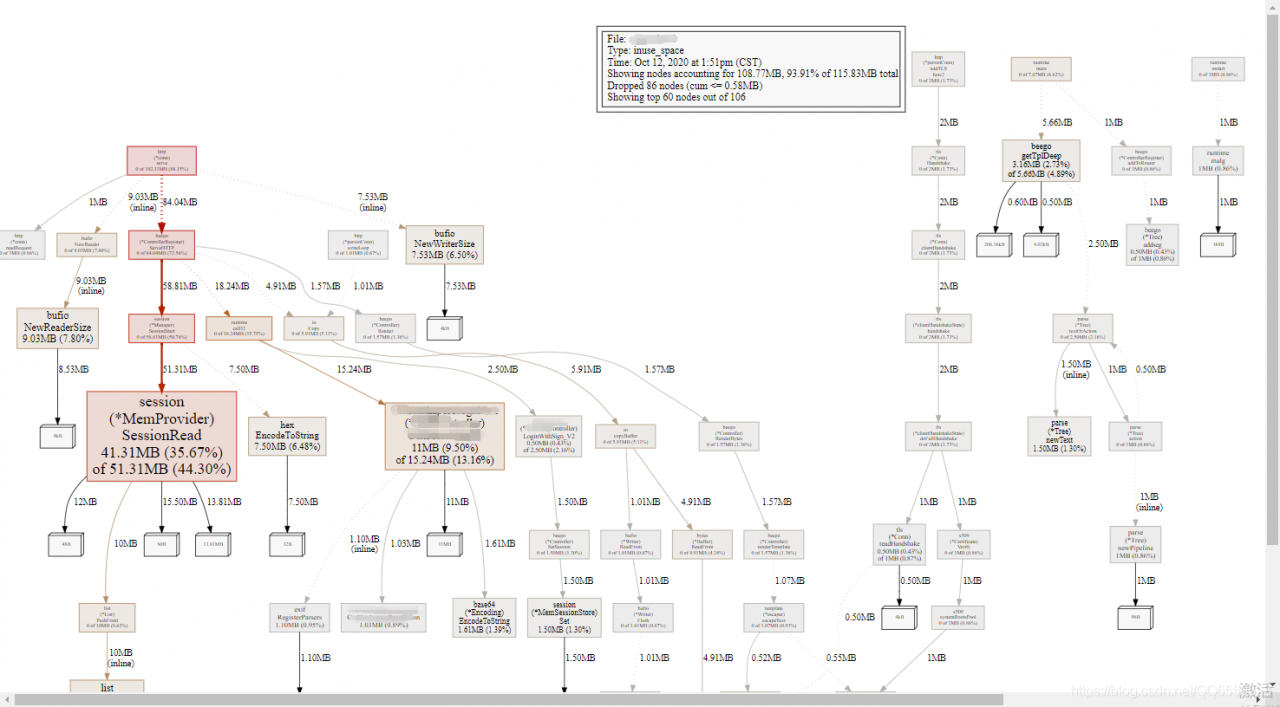
execute go tool pprof your_app mem – 948. Memprof, SVG command input, if prompt dot not installed, in https://graphviz.org/download/ download graphviz, execute right can generate profile001. SVG file, use the browser open, where how much memory consumption of the be clear at a glance.
if you click on the menu get cpuprof, you can view the CPU stack information.
Read More:
- The difference, cause and solution of memory overflow and memory leak
- Android avoids memory leak: reasonable use of getcontext() and getapplication ()
- Memory leak in Windows 8.1 with Killer E2200 and Windows Network Data Usage Monitoring
- TypeError: Failed to execute ‘fetch‘ on ‘Window‘: Request with GET/HEAD method cannot have body.
- Hbase Native memory allocation (mmap) failed to map xxx bytes for committing reserved memory
- WebHost failed to process a request.Memory gates checking failed because the free memory (140656640 …
- os::commit_memory(0x0000000538000000, 11408506880, 0) failed; error=‘Cannot allocate memory‘
- The problem that headers [‘content-type ‘] does not work is set in the Axios get method request interface
- Kvm internal error: process exited :cannot set up guest memory ‘pc.ram‘:Cannot allocate memory
- [idea] error occurred when using @ data annotation in Lombok: no related get / set method was found
- Spring ApplicationContext – Resource leak: ‘context’ is never closed
- Fatal error: Newspace:: rebalance allocation failed – process out of memory (memory overflow)
- Could not find method causes verifyerror, which in turn causes crash
- How to Use Apt get Command Under Mac OSX
- RuntimeError: CUDA out of memory. Tried to allocate 600.00 MiB (GPU 0; 23.69 GiB total capacity)
- Difference between isempty method and isblank method in stringutils
- “Method does not override method from its superclass”
- Memory configuration of BIOS combat
- To solve the problem of increasing video memory when training network (torch)
- [PostgreSQL tutorial] · out of memory issue