turn on debugging function, modify configuration file app.conf:
EnableAdmin = true
AdminAddr = "0.0.0.0"
AdminPort = 8088
access management page: http://your IP :8088/
click on the menu: get memprof, prompt create heap profile mem-948. Memprof means memory information file was successfully generated
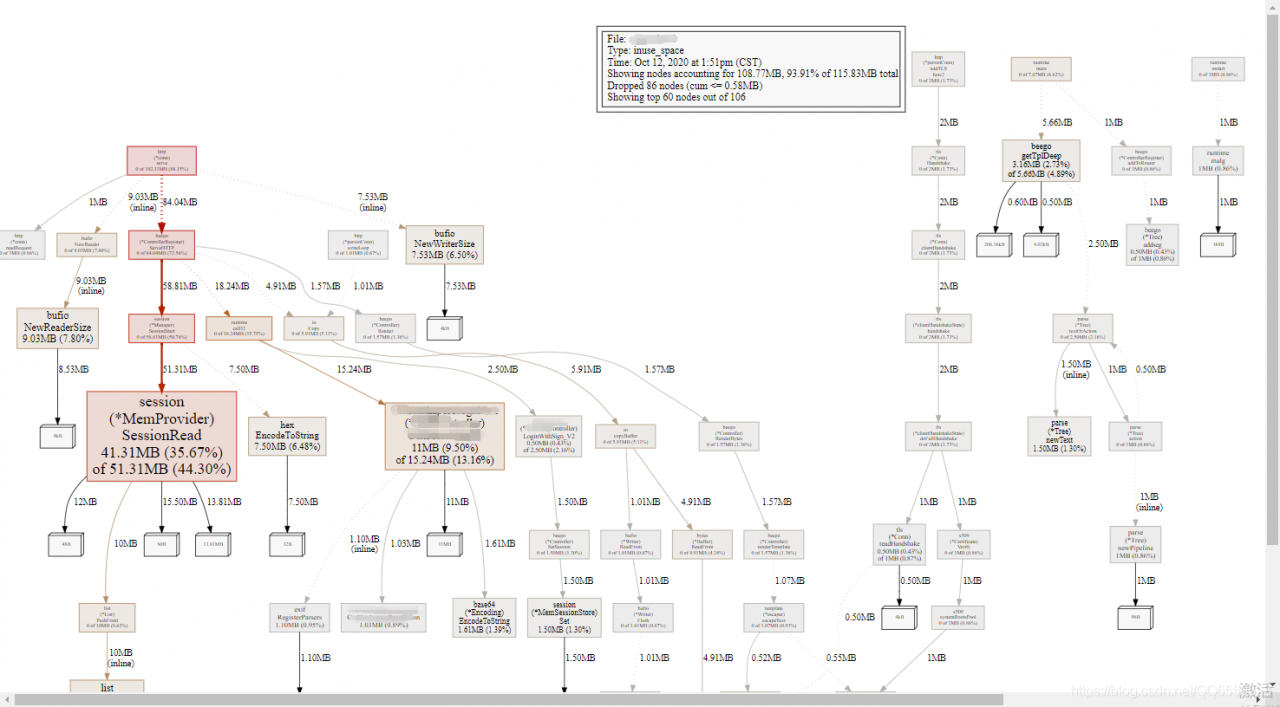
execute go tool pprof your_app mem – 948. Memprof, SVG command input, if prompt dot not installed, in https://graphviz.org/download/ download graphviz, execute right can generate profile001. SVG file, use the browser open, where how much memory consumption of the be clear at a glance.
if you click on the menu get cpuprof, you can view the CPU stack information.