Author Archives: Robins

Java.lang.Character . isdigit() and isletter() methods

[LeetCode] – 125. The Valid Palindrome
In this problem, I encountered a new method to determine whether a string is a letter or a number. Here’s an explanation.
Use isDigit to determine if it is a number

public static boolean isNumeric(String str){
    for (int i = str.length();--i>=0;){
    if (!Character.isDigit(str.charAt(i))){
        return false;
    }
  }
  return true;
}

Use isLetter to determine if it is a letter

public class Test{
   public static void main(String args[]){
      System.out.println( Character.isLetter('c'));
      System.out.println( Character.isLetter('5'));
   }
}

Results:

 true
 false

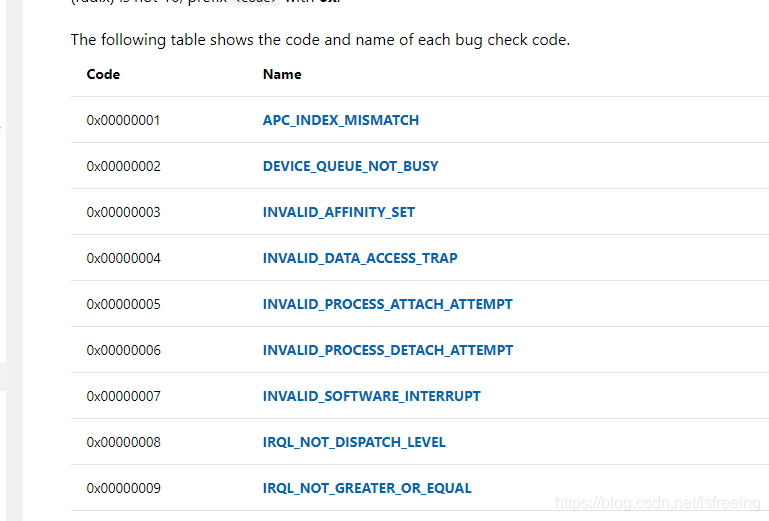
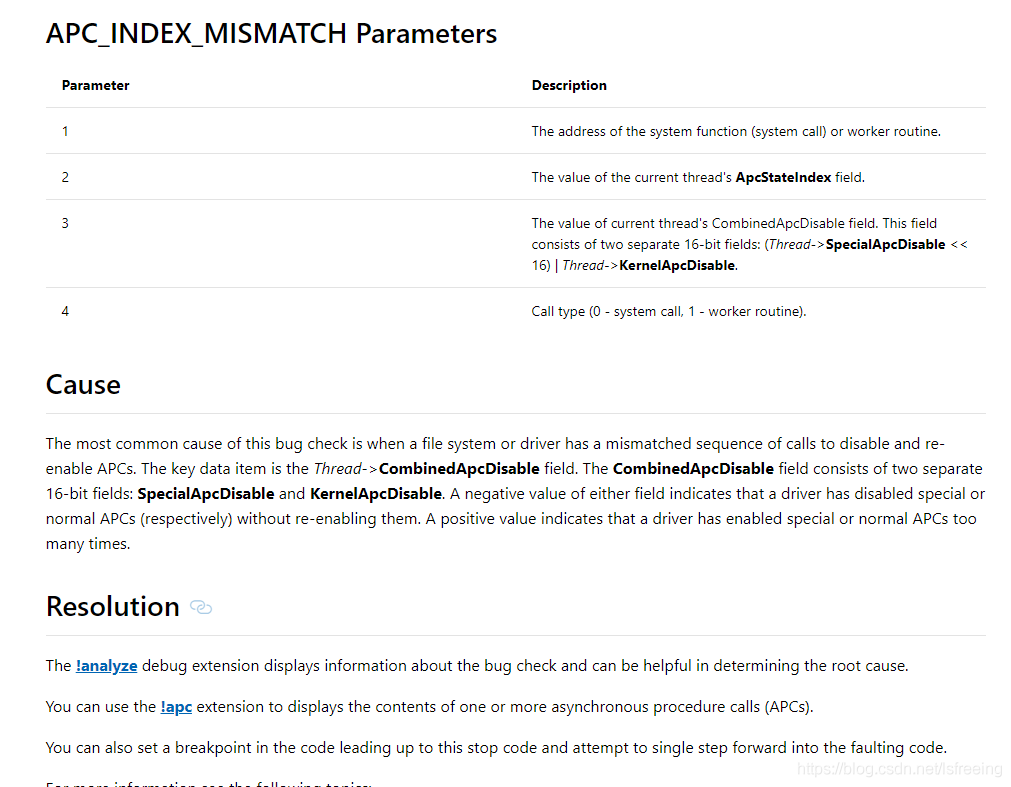
Windows blue screen code query (bug check code)

In the process of development and testing, the computer blue screen is constantly encountered. For different blue screen codes and reasons refer to the official documentation. Although you can’t be 100% sure of the problem, it helps to analyze the problem. Combined with WinDBg is basically very easy to locate.
In the column


For details, please refer to:
https://docs.microsoft.com/en-us/windows-hardware/drivers/debugger/bug-check-code-reference2

BUG: Bad page map in process XXX pte:800000036fae6227 pmd:35be8c067

First of all, given the kernel printing information, the serial port will have some, dmesg will see a little bit more.

BUG: Bad page map in process XXX pte:800000036fae6227 pmd:35be8c067
addr:00007f3fa75c0000 vm_flags:00200070 anon_vma:(null) mapping:(null) index:7f3fa75c0
Pid: 1312, comm: XXX Not tainted 2.6.32.27 #1
Call Trace:
 [<ffffffff815a3570>] print_bad_pte+0x1e2/0x1fb
 [<ffffffff811063ee>] vm_normal_page+0x6e/0x80
 [<ffffffff81107117>] unmap_vmas+0x5b7/0x9f0
 [<ffffffff8106edba>] ?dequeue_signal+0xda/0x170
 [<ffffffff8110cb5c>] unmap_region+0xcc/0x170
 [<ffffffff8110e405>] do_munmap+0x305/0x3a0
 [<ffffffff8110f183>] sys_munmap+0x53/0x80
 [<ffffffff8100c082>] system_call_fastpath+0x16/0x1b
Disabling lock debugging due to kernel taint

Don’t worry about the kernel version number on the stack, because switching to a 3.16.44 kernel will also cause this problem.
The stack seemed to provide a lot of information, but not much help in locating the problem, and at one point led in the wrong direction.
Stack analysis: this stack is obviously a system call, the interface function of the system call is munmap(), in the program code search, only find a few, the analysis of the code seems to see nothing wrong. So in the process to hang up the point, since the stack each time appears in the business thread, so all the business threads in munmap() hang the breakpoint: break munmap thread idx, and then break munmap thread idy… Not every time a breakpoint is triggered, the stack will be triggered several times before it occurs. This phenomenon began to suspect that the kernel memory problem. Until a display *(0x00007f3fa75c0000) is set, each time the munmap() breakpoint is triggered, an attempt is made to read the value of *(0x00007f3fa75c0000). After an interrupt is triggered, The stack above is printed directly (without setting display, continue and munmap() triggers printing), which is more certain that there is a kernel memory problem.
In the first believe the kernel, doubt their own mentality, the first location of the driver problem, the first thought is netmap driver. View process XXX memory map: cat /proc/1312/maps

...
7f4020021000 default
7f40275c0000 default file=/dev/Vnetmap
7f40a8000000 default anon=3 dirty=3 N0=3
7f40a8021000 default
...

Any surprise to find that 0x7f40275c0000-0x00007f3fa75c0000 = 0x80000000, which is netmap minus the mapping address of the problem (that’s the one on the top display) is equal to 2G. Every time. One face muddleheaded, think of this matter what mechanism caused by the kernel, then walked to read the kernel memory management code, focused on the mmap() system call flow. I’ll probably think about it first. mmap() system call flow is simple as follows:

do_mmap_pgoff
   |
   |--get_unmapped_area
   |--...
   |--mmap_region
        |
        |--find_vma_repare
        |--...
        |--file->f_op->mmap
        |--...

The above file - & gt; f_op-> Mmap is specific to the file function, also note the above device file /dev/Vnetmap when the user program opens it and puts its file descriptor fd to mmap() then it can be tuned to Vnetmap custom file-> f_op-> Mmap . He is in the Vnetmap driver implementation, the problem is here.
Analysis: The running environment is 64-bit X86 platform. Vnetmap is the driver module, running in kernel state, it maps the memory applied in the kernel bit by bit to the user virtual address space. It USES a variable of type int as the cumulative count of the virtual address offset, after the offset exceeds 2G, int has a sign flip and becomes negative, and the offset becomes -2g , which seems to be associated with the above.
Understand: (this part didn't source, pure analysis is only for convince yourself that it is not much time, but also does other, have the time to analyze) beyond 2 g memory of kernel space, actual associated with a page table (error), but not visible in the area of the page (eara), errors associated with user mode space is redistributed, find a page table is associated with the page frame, print the above error.


Contact: [email protected]

Ranger Solr audit log installation

Install Solr using RangerAdmin, based on an existing SOLR environment, primarily to create CoreAdmin in Solr for storing data.
Unpack and install
on solr’s installation machine, get RangerAdmin and unpack,
and then, in the RangerAdmin installation directory, go to the solr installation directory for audit
CD /home/solr/ ranger-0.7.0-snapshot -admin/contrib/solr_for_audit_setup
Use the solr user installed above and modify the directory for the configuration item description in /home/solr/solr-5.5.2
reference file. The modifications are as follows:
‘ ‘ ‘
SOLR_USER=solr
SOLR_GROUP=hadoop
SOLR_INSTALL=false
SOLR_INSTALL_FOLDER=/home/solr/solr-5.5.2
SOLR_RANGER_HOME=/home/solr/solr-5.5.2/ranger_audit_server
SOLR_RANGER_PORT=8983
SOLR_DEPLOYMENT=standalone
SOLR_RANGER_DATA_FOLDER=/home/solr/solr-5.5.2/ranger_audit_server/data
SOLR_LOG_FOLDER=/home/solr/solr-5.5.2/ranger_audits/ server/data
SOLR_LOG_FOLDER=/home/solr/solr-5.5.2/ranger_audits/logs
‘ ‘
# 3. Install and execute the script
./setup.sh using root

/home/solr/solr-5.5.2/ranger_audit_server/install_notes.txt
solr shut down the original solr, use the following script:
solr start:
/home/solr/solr-5.5.2/ranger_audit_server/scripts/start_solr.sh
solr stop:
/home/solr/solr – 5.5.2 ranger_audit_server/scripts/stop_solr. Sh
Look at the ranger_audits
log to solr’s web interface, you can see CoreAmdmin already creating the ranger_audits
http://10.43.159.9:8983/
Solr audit log
install.properties configuration for RangerAdmin is as follows:
` ` `
audit_store = solr
audit_solr_urls = http://10.43.159.9:8983/solr/ranger_audits
` ` `
with root after the setup, sh RangerAdmin installation.
After installation, change the audit database method
conf/ranger admin-site.xml modify the following configuration item:
‘ ‘
< property>
& lt; name> ranger.audit.solr.urls< /name>
& lt; value> http://10.43.159.9:8983/solr/ranger_audits< /value>
& lt; description />
< /property>
“`
# # # 8. Other:
installation reference:

https://cwiki.apache.org/confluence/display/RANGER/Install+and+Configure+Solr+for+Ranger+Audits+-+Apache+Ranger+0.5
 

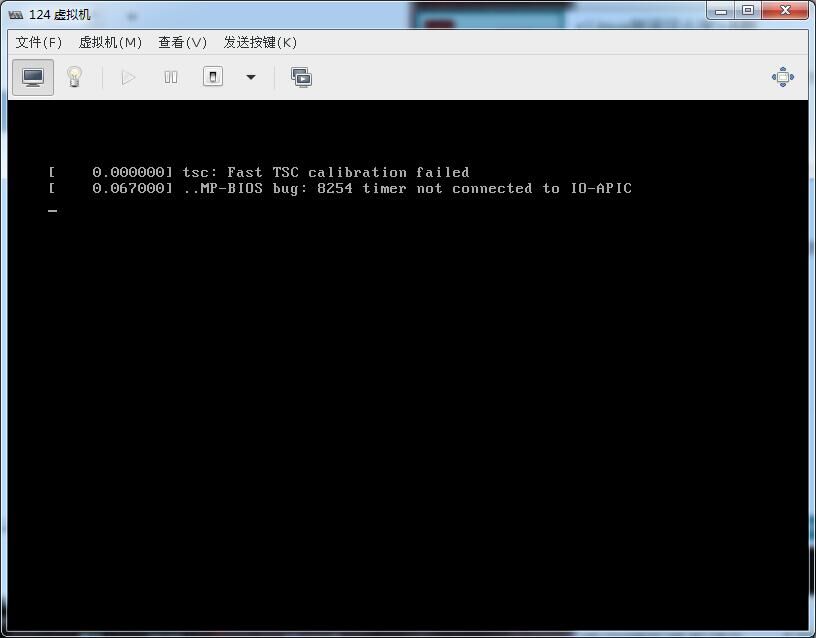
MP-BIOS bug: 8254 timer not connected to IO-APIC

KVM inside boot error prompt:
tsc: Fast TSC calibration failed
MP-BIOS bug: 8254 timer not connected to IO-APIC

Try this method:
After you boot into the GRUB command line, add the no_timer_check parameter to the kernel command line. After entering the system, modify grub.cfg and add this no_timer_check parameter.

[Linux] [kernel] bug: scheduling while atomic problem analysis

The kernel module local_clients is used to listen for DHCP packages and write the host name, IP, MAC, etc to file /proc/local_clients/local_clients_info, and the Webserver parses this question. MyPhone
/TMP # cat /proc/local_clients/local_clients_info
58-7f-57-8b-bc-0d 192.168.0.100 myPhone
now we need to improve this module by adding monitoring DNS messages to determine the IP and MAC of the host connected to AP. The result is written to /proc/local_clients/local_clients_info, and the problem is resolved in user space. If an entry with an UNKNOWN hostname is found, the hostname is obtained through the user program client_mGMT via NBNS or MDNS.
/TMP # cat /proc/local_clients/local_clients_info
14-cc-20-16-fb-da 192.168.0.110 UNKNOWN
Problem: The function of resolving host name was realized, but it took more than 2 hours to run, and the serial port appeared abnormal printing as follows:
[3419.912000] BUG: scheduling while atomic:client_mgmt/1051/0x00000100
[3419.916000] Modules linked in: Umac ath_dev(P)ath_rate_atheros(P) ath_hal(P) asf(P) adf(P) athrs_gmac local_clients
[3419.928000] Cpu 0
[3419.932000]

0:00 000000000000010000000000000000 [3419.936000]
4:000041 832e4500 000000fe 23c637bb
[3419.944000]

And b9aca00129b0ea4c4ec4e0cfffffff8 [3419.948000]
12 :fffffffe 592f6656 00000004031a4
[3419.952000]

16:00 000 d5b832d0000000010000041a1a8 [3419.960000]
20 :825c3e98 000000041a1a8 00001000
[3419.964000]

00000 f800b22c8 24:00 [3419.972000]
28 :825c2000 825c3e50 825c3f10 832c42c0
[3419.976000] Hi :000fd669
[3419.980000] Lo :2c3458d0
[3419.980000] epc :832d42d8 remove_timeout_stas+0x4c/0x8c [local_clients]
[local_clients] 3419.988000] Tainted: P
[3419.992000] ra: 832 d42c0 remove_timeout_stas + 0 x34/0 x8c [local_clients]
[3420.000000] Status: 1000 ff03 KERNEL EXL IE
[3420.004000] Cause: PrId :00019374 (MIPS 24Kc)
~ #
~ # ps
PID USER VSZ STAT COMMAND
1 root 1512 S init
2 root 0 SW< [kthreadd]
3 root 0 SW< [ksoftirqd/0]
4 root 0 SW< [events/0]
5 root 0 SW< [khelper]
6 root 0 SW< [async/mgr]
7 root 0 SW< [kblockd/0]
8 root 0 SW [pdflush]
9 root 0 SW [pdflush]
10 root 0 SW< [kswapd0]
13 root 0 SW< [mtdblockd]
1059 root 1512 S sh -c cat /proc/local_clients/local_clients_info >/TMP /log.txt
1060 root 1504 D cat /proc/local_clients/local_clients_info
1071 root 3716 S /usr/bin/httpserver
1072 root 1512 S sh-c client_mgmt -s 192.168.0.101
1073 root 1196 D Client_mgmt-s 192.168.0.101
1074 root 1512 s sh-c cat /proc/local_clients/local_clients_info >/TMP /log.txt
1075 root 1504 D cat /proc/local_clients/local_clients_info
1164 root 3716 S /usr/bin/httpserver
1165 root 1512 S sh-c client_mgmt-s 192.168.0.101
1166 root 1196 D /usr/bin/httpserver
1165 root 1512 S sh-c client_mgmt-s 192.168.0.101
1166 root 1196 D Client_mgmt-s 192.168.0.101
1167 root 1512 s sh-c cat /proc/local_clients/local_clients_info >/TMP /log.txt
1168 root 1504 D cat /proc/local_clients/local_clients_info
1225 root 3716 S /usr/bin/httpserver
1226 root 1512 S sh-c client_mgmt-s 192.168.0.101
1227 root 1196 D /usr/bin/httpserver Client_mgmt-s 192.168.0.101
1228 root 1512 s sh-c cat /proc/local_clients/local_clients_info >/TMP /log.txt
1229 root 1504 D cat /proc/local_clients/local_clients_info
1441 root 3716 S /usr/bin/httpserver
1442 root 1512 S sh-c client_mgmt -s 192.168.0.101
1443 root 1196 D Client_mgmt-s 192.168.0.101
1444 root 1512 s sh-c cat /proc/local_clients/local_clients_info > /tmp/log.txt
1445 root 1504 D cat /proc/local_clients/local_clients_info
Remove_timeout_stas is an aging operation on the global variable l_clientS_info_list. The whole process is protected by a MUtex. It is suspected to be a mutex deadlock, but when I check the code, I find no place where unlock does not return. A special tip found in the logs: Scheduling Whileatomic; Search the key word, found that article: http://blog.csdn.net/cfy_phonex/article/details/12090943; When the Linux kernel prints bugs: scheduling from the idlethread “and” bad: scheduling from the idlethread “, it is usually a function called in the interrupt processing function that can sleep, such as semaphore,mutex,sleep, etc. It’s related to mutex. But the puzzle is when dealing with interrupts. Where are the interruptions?
looks at the log and finds that cat processes are all stuck. Could it be the interrupt caused by cat?Looking up the instructions for CAT, CAT prints a file to the standard output device. Since CAT produces interrupts, interrupt processing is to open the file and output it to the terminal, focusing on the processing function that reads the PROc file.
kernel module local_clients registers a method for manipulating proc files/here’s another one to explore/:
static structseq_operations clients_seq_ops = {
.start = clients_seq_start,
.next = clients_seq_next,
.stop = clients_seq_stop,
.show = clients_seq_show
}; When the cat/proc/local_clients/local_clients_info is called, clients_seq_start is executed first and clients_seq_show, clients_seq_start is executed next:
{
printk(” pos = % LLD \n “, *pos);
remove_timeout_stas();/Mutex_lock (& amp; amp) is called in this function. local_clients_mutex);/
//mutex_lock(& local_clients_mutex);
if (*pos > = MAX_WIRELESS_CLIENTS_NUM)
{
return NULL;
}
printk(” return addr: %p, pos = % LLD \n “,l_clients_info_list + *pos, *pos);

return l_clients_info_list + *pos;

}
problem caused by: two operations called mutex_lock; A cat-triggered interrupt invokes the read /proc/local_clients/local_clients_info. A cat-triggered interrupt invokes the read function clients_seq_start in the proc file system. Local_clients_mutex).
another is that when a HOST in WLAN issues a DNS message and local_clients listens to a DNS message, it also invokes mutex_lock(& amp; amp) before adding the IP, MAC, and HOST information of the HOST sending the message to the file local_clients_info. Local_clients_mutex);
means that there are two orders. One is that when the cat interrupt handler is called, local_clients adds an entry that causes the cat interrupt handler to be scheduled and reports an error. Alternatively, local_clients calls mutex_lock when adding an entry, and cat interrupts trigger calls mutex_lock, and the mutex_lock in the interrupt waits, so the interrupt handler goes to sleep, which is against the purpose of the interrupt handling mechanism.
Solution: Use spin_lock instead of mutex_lock. The difference between the two is: spin_lock, which can be checked repeatedly to see if the lock can be obtained, but will not fall asleep (busy waiting, so the spin_lock protection code should be short and dry, not consuming too much CPU time). The semaphore, while waiting for the signal to be released, goes to sleep until it is awakened; The interrupt handler cannot go to sleep (that is, cannot call sleep, or wait for a semaphore resource).

test 1)
tests mutex_lock before modification and spin_lock after modification. Shell script is used to loop cat /proc/local_clients/local_clients_info file, and a bat script is used for nslookup operation on WLAN terminal PC to make PC continuously send DNS message. The test finds that mutex_lock is used to give error prompt:
/TMP # tftp-g 192.168.0.104-r test.sh; Chmod 777 test. Sh
test. 100% sh | * * * * * * * * * * * * * * * * * * * * * | 78 ETA
/TMP 0:00:00 # 192.168.0.104 TFTP – g – r test. Sh. Chmod 777 test. Sh
test. 100% sh | * * * * * * * * * * * * * * * * * * * * * | 78 0:00:00 ETA #.
/TMP/test. The sh
[193.176000] BUG: scheduling while atomic: Cat /1835/0x00000100
[193.184000] Modules linked in: Umac ath_dev(P) ath_rate_atheros(P) ath_hal(P) asf(P) adf(P) athrs_gmac local_clients tp_domain parentCtrl
[193.196000] Cpu 0
[193.200000]

0:00 000000000000010000000100000000 [193.204000]
4:000030 832e32ac 00000080 c4653600
[193.208000]

And b9aca00364c598bc4ec4d38fffffff8 [193.216000]
12:0000002d 592f59ba 0000003f 00455924
[193.220000]

16:00 0000 c1832d0000000010007fc7fc70 [193.224000]
20:825cde98 00000000 7fc7fc70 00001000
[193.232000]

0000 a9800b22c8 24:00 [193.236000]
28:825cc000 825cde50 825cdf10 832d42c0
[193.240000] Hi: 001a99e2
[193.244000] Lo: 8f4e21b0
[193.248000] 832 d42d8 remove_timeout_stas + 0 x4c/0 x8c [local_clients]
[193.256000] Tainted: P
[193.260000] ra: 832 d42c0 remove_timeout_stas + 0 x34/0 x8c [local_clients]
[193.264000] the Status: 1000ff03 KERNEL EXL IE
[193.268000] Cause: 10800400
[193.272000] PrId: 00019374 (MIPS 24Kc)
test 2)
whether it is possible to be caused by multiple cat mutex_lock calls lead to problems
execute multiple cat call scripts in the shell, run for a long time, there is no problem; Cat is a user-mode process, so does the kernel perform two open files at the same time?
the answer is no, it involves the process scheduling, cat is the user mode process, and the punching file belongs to the kernel mode operation, from the user mode to the kernel mode operation, there are two ways, 1 is the system call, 2 is the interrupt, here is obviously the use of system call. If the system is in a core mindset and is processing system calls, then no other process in the system can steal CPU time and the scheduler must wait for the system call to complete before it can choose another process to execute, but an interrupt can terminate the system call. So the problem is probably caused by mutex_lock.
Cont:
in AP(MTK7628), when the mi 6 connection, there is a similar problem, causing other wireless devices can not connect to AP, but in the latest version of MIUI V8.2.23.0 this problem has been fixed.
[06-07 12:03:49]BUG: scheduling while atomic: RtmpMlmeTask/154/0x00000100
[06-07 12:03:49]Modules linked in: mt_wifi
[06-07 12:03:49]Cpu 0
[06-07 12:03:49]

00000000000000 c03582ec00000002 0:00 [06-0712:03:49]
4 : c0503000 c05e2728 00000000 c050a6ef
[06-07 12:03:49]

8: c050a6fc80f53d3e0000000480f53d44 [06-0712:03:49]
12 : 00044000 00000004 00000002 00000000
[06-07 12:03:49]

16:00 000002 c05e2728c0503000c0360000 [06-0712:03:49]
20 : c04844bc c03e0000 c048436c c043fdac
[06-07 12:03:49]

000000 c0358e28 24:00 [06-0712:03:49]
28 : 80f52000 80f53db8 c0484284 c03e334c
[06-07 12:03:49]Hi : 00000000
[06-07 12:03:49]Lo : 00000040
[06-07 12:03:49]epc : c03582ec RTMPCheckEntryEnableAutoRateSwitch+0x0/0x90 [mt_wifi]
[06-07 12:03:49] Not tainted
[06-07 12:03:49]ra : c03e334c APMlmeDynamicTxRateSwitching+0x130/0x9a8 [mt_wifi]
[06-07 12:03:49]Status: 1100ff03 KERNEL EXL IE
[06-07 12:03:49]Cause : 50808000
[06-07 12:03:49]PrId : 00019655 (MIPS 24Kc)
SevenZipSharp

github:https://github.com/tomap/SevenZipSharp
The compression ratio is very high, with a 32-bit core of 64 bits

if (Environment.Is64BitProcess)
{
      SevenZipBase.SetLibraryPath("7z64.dll");
}
else
{
      SevenZipBase.SetLibraryPath("7z.dll");
}

Reference: https://www.cnblogs.com/gdouzz/p/7090710.html

Ranger yarn plug-in installation

Ranger-0.6.0-yarn-plugin is installed to all ResourceManager nodes of the Yarn. Other NodeManager nodes
do not need to be installed.
Landing HDFS install user, garrison/zdh1234 hadoop (user group), obtain installation package decompression
SCP/home/backup/ranger/ranger – 0.6.0 – yarn – plugin. Tar. Gz.
the tar – ZXVF ranger – 0.6.0 – yarn – plugin. Tar. Gz.
vi install properties
modify parameters is as follows:

POLICY_MGR_URL=http://10.43.159.245:6080
SQL_CONNECTOR_JAR=/usr/share/java/mysql-connector-java.jar
REPOSITORY_NAME=yarndev
CUSTOM_USER=garrison
CUSTOM_GROUP=hadoop

To install the Ranger Yarn Plugin, note:./ enabled-plugin. sh script should be run as root. :
./ enableyarn-plugin. sh
needs to restart after the creation of the Yarn.
ZDH – 245 bales to garrison of ZDH – 240
SCP garrison @ ZDH – r – 245:/home/garrison/ranger – 0.6.0 – yarn – plugin.
root installation script execution, and restart the yarn.
The Service of HDFS plugin
YARN new Service registered in Ranger-Admin is modified as follows

Service Name = yarnpdev
UserName = garrison
Password = zdh1234
YARN REST URL = http://10.43.159.240:8188

Then click TestConnection to save successfully.
Close the all-queue policy,
create root.default policy, and give mysql users the right to submit the queue.
use mysql user to perform mapreduce task, give mysql access to the corresponding directory of HDFS:

export JAVA_HOME=/usr/share/java/jdk1.7.0_80
/home/garrison/hadoop-2.7.1/bin/hadoop jar /home/garrison/hadoop-2.7.1/share/hadoop/mapreduce/hadoop-mapreduce-examples-2.7.1.jar wordcount -Dmapreduce.job.queuename=default hdfs://gagcluster/usr/wordcout.txt /usr/wordresult_002
/home/garrison/hadoop-2.7.1/bin/hadoop fs -text /usr/wordresult_002/part-r-00000

User usersync cannot submit applications to queue root.default
Yarn queue permissions enable capacity schedule queues to implement
Yarn -site.xml configuration file to add configuration items:

<property>
    <name>yarn.resourcemanager.scheduler.class</name>    
    <value>org.apache.hadoop.yarn.server.resourcemanager.scheduler.capacity.CapacityScheduler</value>
</property>

The capacity-scheduler. XML configuration is as follows, allowing only the garrison user to submit a job:

<property>
  <name>yarn.scheduler.capacity.root.acl_submit_applications</name>
   <value>garrison</value>
   <description>
     The ACL of who can submit jobs to the root queue.
   </description>
 </property>
 <property>
  <name>yarn.scheduler.capacity.root.acl_administer_queue</name>
  <value>garrison</value>
  <description>
    The ACL of who can administer jobs on the default queue.
  </description>
</property>
<property>
  <name>yarn.scheduler.capacity.root.default.acl_submit_applications</name>
  <value>garrison</value>
  <description>
    The ACL of who can submit jobs to the default queue.
  </description>
</property>
<property>
  <name>yarn.scheduler.capacity.root.default.acl_administer_queue</name>
  <value>garrison</value>
  <description>
    The ACL of who can administer jobs on the default queue.
  </description>
</property>

Memory leak in Windows 8.1 with Killer E2200 and Windows Network Data Usage Monitoring

Recently upgraded to a new computer with Intel’s latest Haswell generation and Microsoft Windows 8.1. Although its performance has been stellar, a few days ago unexpectedly ran into severely degraded performance.
Saw in the Task Manager that all available memory was taken up by the Non-Paged Pool. After a system reboot the memory used by the Non-Paged Pool quickly started to increase until all memory was taken.
Looked up what information could fine online about memory leaks in Windows 8.1 and came upon this forum post in which others detailed similar experiences when using Windows 8 on hardware equipped with Qualcomm’s Killer ethernet networking products.

The actual cause of the memory leak seems to be the Windows Network Data Usage Monitoring Driver service which in combination with a Killer network driver starts to fill up the Non-Paged Pool memory.
Considering that my MSI H87-G43 Gaming motherboard is equipped with the Killer Ethernet E2200 and am using the Killer Network Manager driver, knew it had to be the same cause.
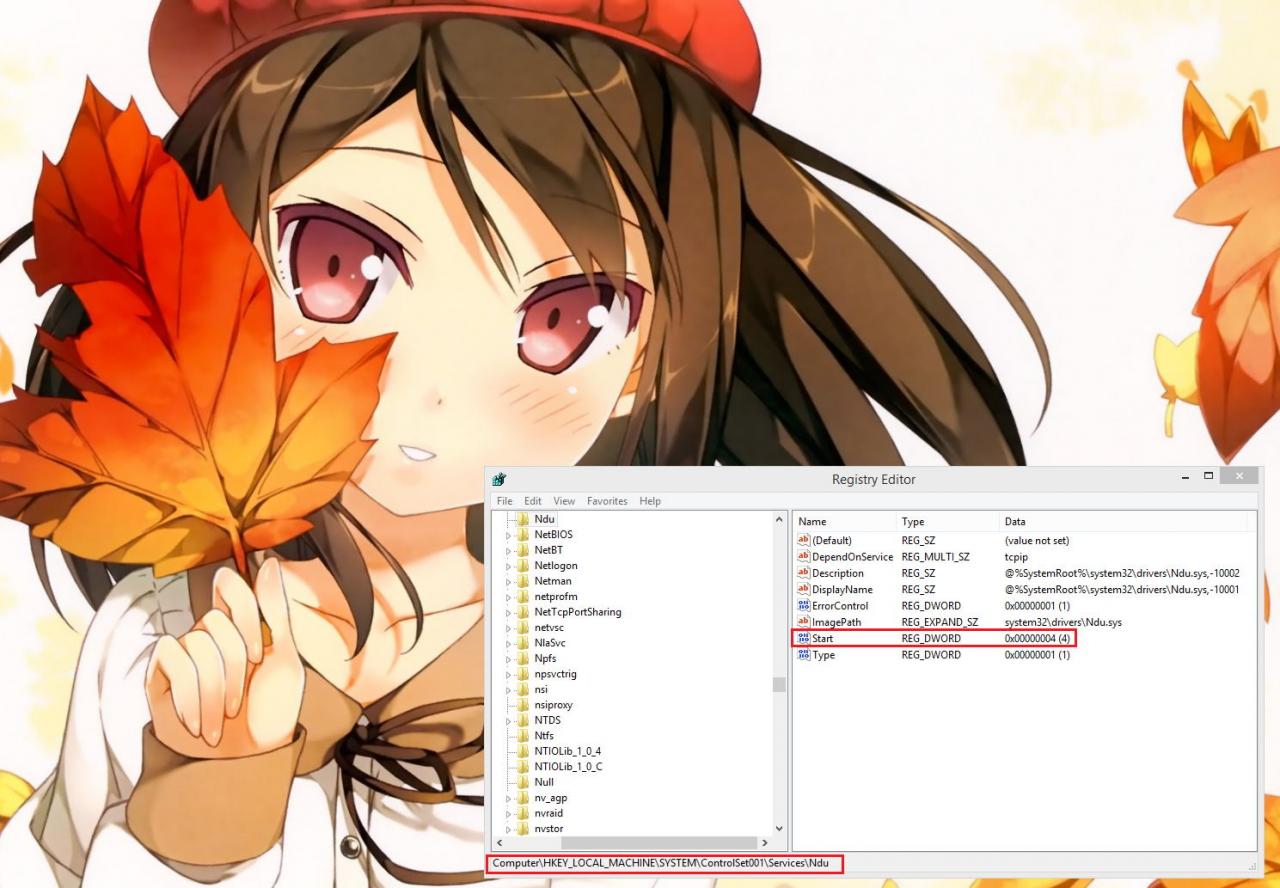
Applied the suggested fix of altering the registry key value of the “Start” entry to 4 in HKEY_LOCAL_MACHINE\SYSTEM\ControlSet001\Services\Ndu\ to disable the Windows Network Data Usage Monitor Driver from starting and after a reboot the issue seems properly solved!

How to Fix COM Surrogate has stopped working in Windows 7


A client of mine started having a strange problem when browsing pictures and videos on his Windows 7 PC: it would popup with the following error message:

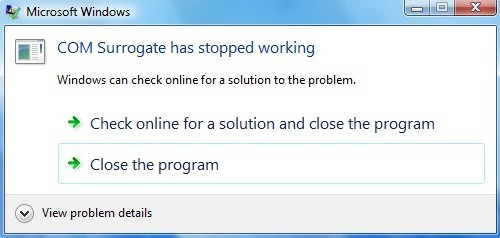
COM Surrogate has stopped working


The odd thing was that the error only came up when browsing video or picture files, not any other type of file. After doing some research, we managed to fix the problem, but had to try a couple of different things before it finally worked. In this post, I’ll write out the different possible solutions and hopefully one of them will work for you.
Method 1 – Update Codecs
Obviously since it was a video/picture problem, we thought it could be something with the current set of codecs installed. This client in particular liked to copy and rip stuff, so he had ffdshow installed plus some other codecs. We manually updated all the codecs to their latest versions including ffdshow, Windows 7 Codec Pack and others.  You can download the latest version of Windows 7 Codec Pack here.
If you have DivX or Nero installed on your computer, go ahead and update those to the latest versions too. In some cases, you may have to uninstall a program and then reinstall it later on.
Method 2 – Kaspersky Antivirus
There has been a known issue with Kaspersky antivirus that cases this problem to occur. If you’re using Kaspersky, you need to make sure you update the actual Kaspersky software, not just the antivirus definitions. You can also test to see if this is really causing the issue by disabling the program altogether and seeing if the issue goes away.
Method 3 – Commands
There are a few commands you can try to run in Windows to see if it fixes the problem. You have to run these in the command prompt. Click on Start, type cmd and then right-click and choose Run as Administrator. Now type in the following commands, pressing enter after each one:

regsvr32 vbscript.dll
regsvr32 jscript.dll

That will re-register a few dlls with Windows and possibly fix the COM surrogate error. If not, keep reading!
Method 4 – Check Disk for Errors
If you’re seeing this problem only on a particular drive like an external USB device, then it could be that there are some bad sectors on the hard drive. It’s a good idea to run a chkdsk to make sure the drive is functioning properly. You can read my previous post on how to use the chkdsk utility.
Method 5 – Disable DEP for dllhost.exe
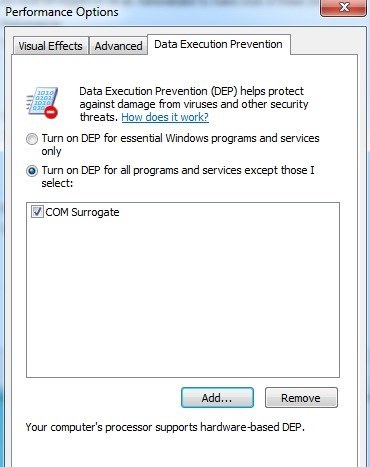
Another fix that has been mentioned numerous times is adding dllhost.exe to the exclusion list for DEP (Data Execution Protection). You can read my previous post on how to turn off DEP in Windows. On the last step in that article, click Add and then add the following exe file in Windows 7 32-bit:

C:\Windows\System32\dllhost.exe

For Windows 7 64-bit, you have to exclude the dllhost.exe file in this path:

C:\Windows\SysWOW64\dllhost.exe


Method 6 – Display/Printer Driver
This can be a little tricky, but if you recently updated a driver for your display or even some other hardware on your computer, try to roll back the driver to the previous version. It’s usually more so with the display driver than anything else. In some cases, updating to the most recent version of the display driver can also fix the issue, so you’ll have to play around with either upgrading the driver or rolling back the driver.
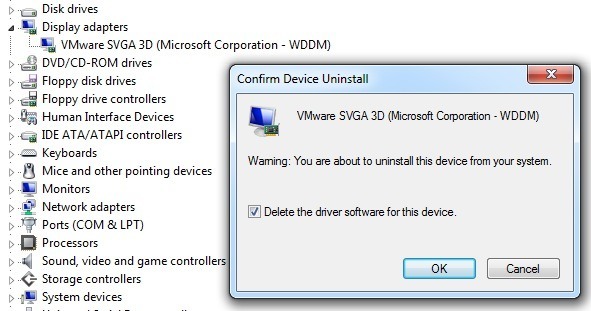
To rollback the display driver, go to Device Manager, expand Display Adapters and then right-click on the display device and choose Uninstall. You’ll see a pop up window where you need to check the Delete the driver software for this device box.

In the same light, you should also check out your printer drivers and update all of them, if updates are available.
Hopefully, one of these methods will fix the COM Surrogate error in Windows 7. If not, post a comment here and let us know your specs and what you’ve tried and we’ll try to help. Enjoy!


How to Fix IDM has been Registered with a Fake Serial Number

Solutions to fix IDM has been registered with a fake serial number:
There are two methods to fix IDM has been registered with a fake serial number error. Prefer using the first one method as it is the better trick to fix the error. If the first method do not work for you then go for the second method.
Also Read: How can I create a PDF Document File for free?
Methods to fix IDM has been registered with a fake serial number error:
– Method 1: Editing the Hosts File
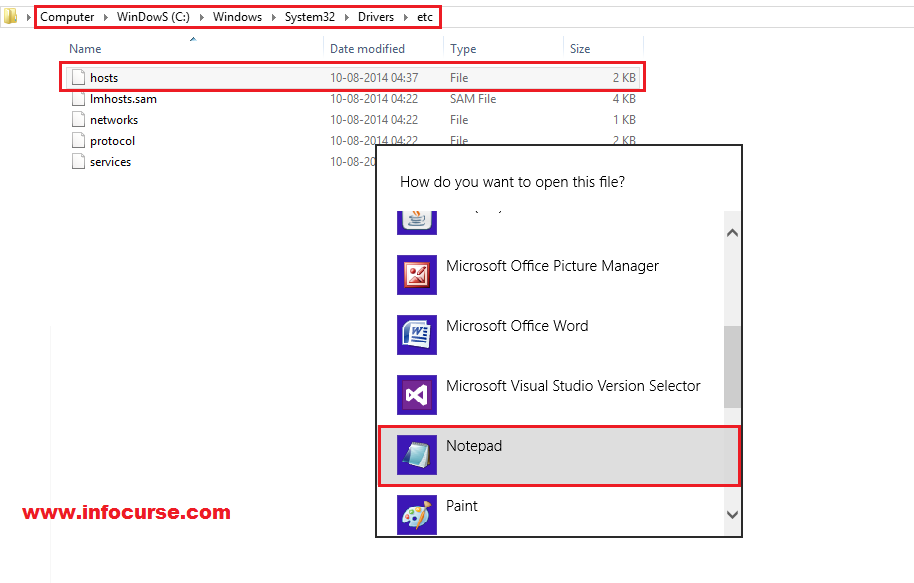
Close all the process of IDM from Task Manager. If it is already closed then move to the next step. Browse to C:\Windows\System32\drivers\etc\hosts. Right click on the “hosts” file and Select “Open with”. Now, choose Notepad.


_Open Hosts File with Notepad_

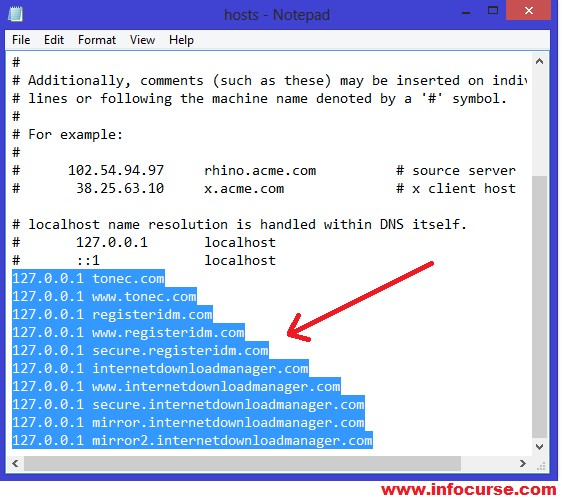
Paste the following Code at the end of the text and save it.
127.0.0.1           tonec.com
127.0.0.1           www.tonec.com
127.0.0.1           registeridm.com
127.0.0.1           www.registeridm.com
127.0.0.1           secure.registeridm.com
127.0.0.1           internetdownloadmanager.com
127.0.0.1           www.internetdownloadmanager.com
127.0.0.1           secure.internetdownloadmanager.com
127.0.0.1           mirror.internetdownloadmanager.com
127.0.0.1           mirror2.internetdownloadmanager.com
127.0.0.1           mirror3.internetdownloadmanager.com


_Paste the code at the end_

Also Read: How To Hide Facebook Status & Photos From Specific\Particular Friends.
If you are unable to save it and an error comes then follow the below steps:
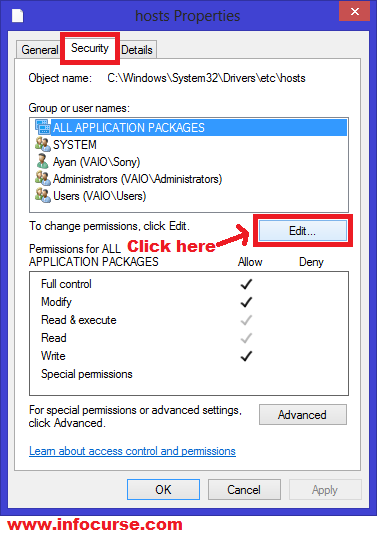
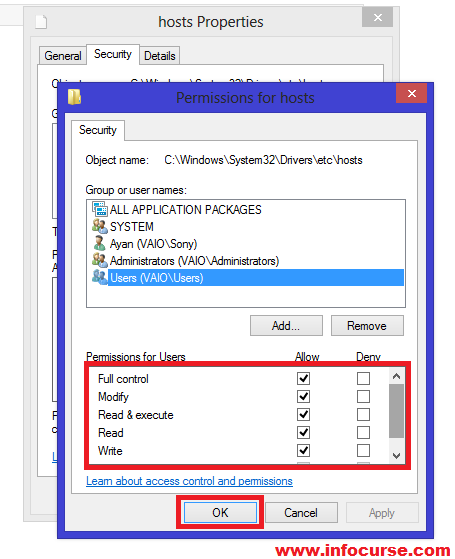
Right click on “hosts” file. Choose “Properties”. Click on “Security” tab. Then click on “Edit” option as shown in the below image.


_Security Tab of Hosts File_

Now a box of Permissions would open on your screen. Choose your User and mark a tick on all permission properties as shown in the below image.


_Permission settings of Hosts File_

Click on OK. Now, try to edit the hosts file.
That’s it. You’re done. Restart your PC and run IDM without any interruption(中断). The error “IDM has been registered with a fake number” has been solved.
#NOTE: This method will work only after restarting your PC.
If Method 1 does not work for you then follow Method 2 below.
Also Read: How to Create fake Facebook Chat | Edit Facebook Chat Conversations.
– Method 2: Tweaking with IDM Files
Go to IDM Installation directory i.e.

C:\Program Files\Internet Download Manager for Windows XP.
C:\Program Files (x86)\Internet Download Manager for Windows 7 and 8.

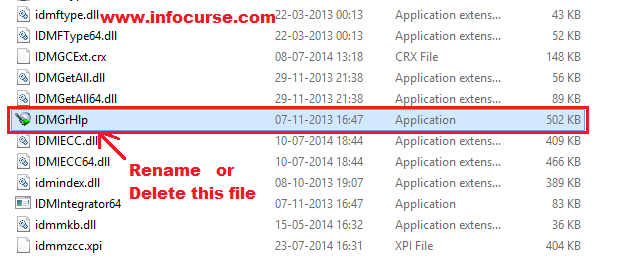
Search for “IDMGrHlp. exe” file. Rename this file or delete it. I would suggest you to delete it.
– Now, whenever you open IDM, a new pop up message would appear on your screen “IDM cannot find 1 file that is necessary for browser and system integration. Please reinstall(重新设置) IDM”.


_Rename or Delete IDMGrHlp_

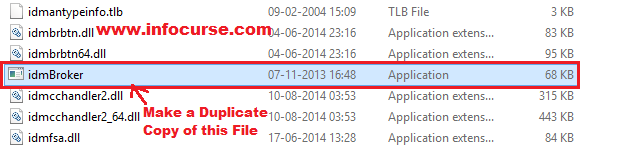
Search for “idmbroker. exe” file. Make a duplicate copy of this file and paste it in the same directory.


_Make a Duplicate copy of idmBroker and paste it in the same directory_

Now, rename this duplicate file to “IDMGrHlp.exe”.
That’s it. You’re done. Restart your PC and run IDM without any interruption(中断). The error “IDM has been registered with a fake number” has been solved.
Also Read: How to Fix SSL Connection Error in Google Chrome Browser – Causes and Solutions.

from:http://www.infocurse.com/solution-idm-has-been-registered-with-fake-serial-number-fixed/

转载于:https://www.cnblogs.com/lovepipi/p/4055356.html

How to Fix Session is not Connecting (How to Diagnose it)

In this blog post of FIX protocol tutorial series I would like to share my experience with connectivity issues around Fix Engines. to exchange message or say to trade electronically clients connect to broker using FIX protocol and for that they use FIX Engine. In FIX protocol connection between two FIX Engine is refereed as FIX Session and we normally say whether FIX Session is connected or not connected. FIX Session normally have there start time , end time and EOD time (End of day time) also called TradingSession start time , Trading Session End Time and Trading Session EOD time.

Fix Session Start time is the time when FIX Engine tries to connect each other , to connect successfully both client and broker must have agreed on Fix Session start time and there FIX engine must be running on that time to make them connect to each other.

Here I will mainly discuss issues I have faced during FIX Session establishment

These are very classic problems and should I say most common problem working with FIX protocol and almost everybody face this problem in there day to day work and has there own way to figure out what exactly is wrong  and how to fix that.

here I am listing some guideline or say an approach for people who just started working on FIX protocol to figure out what is wrong and how to fix that  hope this would help specially to newcomers on FIX protocol.

As per FIX protcol FIX Engine connects to each other over TCP connection on agreed host and port that’s why first check in your log that if there is any logon message 35=A ,if there is no logon message something is wrong on TCP(socket ) level and TCP connection between client FIX Engine  and  broker Fix Engine has not been established.

to verify this just check whether your host is connected to broker host or not by issuing following command.

netstat -a | grep port (port is the one which you are using to connect to broker)

if you don’t see a connection ESTABLISHED means no TCP connection has been established between your host and broker host and something is wrong either with broker FIX engine host or network.

Now check if broker host is pingable or not , to check broker host is alive and not down. you can use “telnet” command for checking that.

telnet hostname port  (here hostname and port is broker host and port)

if you just see “trying ………” means host is not reachable and something is wrong with network may network link issue or any firewall rule

issue, you need to involve network team here for further diagnosis.

Now come to other part , in case you see logon message (MsgType=A or 35=A) in your log and still session is not establish then check for logout

message (MsgType=5 or 35=5) by seeing Text(tag 58) here you can figure out why session is not connecting may be sequence number mismatch.

Now there could be two reason :

1) Either broker is logging you out because you are sending sequence no less than what broker is expecting. In this case you need to reset

your Outgoing sequence Number to what broker is expecting.

2) In case your Fix engine is logging out broker because broker is sending sequence number less than what your Fix Engine is expecting ,In this

case you need to reset your Incoming sequence number.

Sequence number reset can also be done on broker side in opposite way you are doing but before doing that intranet you need to think why sequence number got mismatched and in case of any replay there would not be any side effect.

–>

to read more about FIX protocol , please see my FIX protocol tutorial series

Read more: http://javarevisited.blogspot.com/2011/01/fix-protocol-tutorial-fix-session-is.html#ixzz2pmu2gBLp