suggests that there may be two conflicting functions, which can be resolved by creating a package plus function. The solution is shown in the following figure:

or a plyr package
detach(” package:plyr “)
Refer to the link: https://www.jianshu.com/p/491b6eca2d9a
Tag Archives: r language
In R language, for loop or array truncation, the following error occurs only 0’s may be mixed with negative subscripts
This error is usually caused by writing arrays like x[i-10: I + J-10], and is corrected by enclosing i-10 and I + J-10 in parentheses, such as x[(i-10): I + J-10)].
This will solve the problem, the R beginners must pay attention to these details, otherwise they will be tormented by this small problem
Analysis of R language error replacement has length zero problem
I encountered this problem before when I was doing a for loop, where the second layer of the loop is
, ncol=3, so here the loop is going to befor(j in 1:2)and then the assignment matrix is the following error.
After 
, it was found on the Internet that the error was caused by improper alignment of array or matrix or out-of-bounds subscripts. After checking the code, it was found that there was indeed a small error, that is, for(j in 1:ncol-1) is equivalent to for(j in 0:1). Obviously, an error will be reported when assigning the value. for(j in 1: ncol-1)) correct.
【R】【unimplemented type ‘list’ in ‘orderVector1’】
I. Problem description
When using the R language, you want to use the order function for a matrix to sort by a column, and the result is an error
> print(rep_motion)
       [,1]        [,2]         [,3]
  [1,] NaN         NaN          NaN
  [2,] 0.0434575   0.01098376   0.9512894
  [3,] 0.001588562 0.001588562  0.99722
  [4,] 0.004219409 0            0.9978903
  [5,] 0.004721435 0.0006295247 0.9952786
  [6,] 0.008078995 0.000598444  0.9931179
  [7,] 0.01246883  0.009975062  0.9806733
  [8,] 0           0            1
  [9,] 0.03324361  0.02113055   0.9510094
  [10,] 0.02582149  0.01563      0.9611535
  [11,] 0.006769826 0.005802708  0.9883946
  [12,] 0.001959248 0.0003918495 0.9980408
  [13,] 0.002842524 0.0005685048 0.9971575
  [14,] 0.00748183  0.001710133  0.9910218
  [15,] 0.02713675  0.01901709   0.9626068
  [16,] 0.03195067  0.009529148  0.9646861
  [17,] 0.01386159  0.01799938   0.9778628
  [18,] 0.02140673  0.1569827    0.9006116
  [19,] 0.06902854  0.01588641   0.9190215
  [20,] 0.006300257 0.003150128  0.9912957
  [21,] 0.01619586  0.006779661  0.9777778
  [22,] 0.006226313 0.00351922   0.9910666
  [23,] 0.01170929  0.005552047  0.9836333
> rep_motion[order(rep_motion[,3])]
   Error in order(rep_motion[, 3]) : unimplemented type 'list' in 'orderVector1'
Ii. Problem Solving
Check out the type of REP_motion:
> typeof(rep_motion)
  [1] "list"
> mode(rep_motion)
  [1] "list"
> class(rep_motion)
  [1] "matrix"
The reason is that when you create this matrix, you group each row together as a list, so that when you order, you are ordering the list, not the number. Numbers are sized so they can be sorted, while list is not, so it will report an error.
when your matrix changes to the following type, it will not report an error.
> typeof(evaluated)
  [1] "double"
> mode(evaluated)
  [1] "numeric"
> class(evaluated)
  [1] "matrix"
It depends on how you define it. If you still have not solved, welcome to exchange in the comments section!
R language-Error in file(out, “wt”): Unable to open the link problem solved
There was a problem viewing the command help using the help() command. Help page display:
Error in File (out, “wt”) : Unable to open link
2. Solutions:
Just restart RGui, close RGui, and then open again to restore normal.
The possible cause is the loss of help files due to the manual removal of temporary files from the operating system.
Error in ogrListLayers(dsn = dsn): Cannot open data source is reported when readOGR loads the shapefile
The reason is that we only put SHP files in the working directory, but not the corresponding DBF and SHX files in the working directory, just put these files in the working directory.
Error in loadNamespace(j <- i[[1L]], c(lib.loc, .libPaths()) error appears in the R language installation package
But anyway,
> library("ggplot2")
Error in loadNamespace(j <- i[[1L]], c(lib.loc, .libPaths()), versionCheck = vI[[j]]) :
  不存在叫‘munsell’这个名字的程辑包
In addition: Warning message:
程辑包‘ggplot2’是用R版本3.2.3 来建造的
Error: ‘ggplot2’程辑包或名字空间载入失败,
This error is caused by not installing Munsell packages. Just install. Packages (“munsell”) in the console
R language error:‘ namespace:lazyeval There is no exit_ The object is eval
attention WeChat common number: small range online

Follow CSDN blog: cheng zhiwei’s blog
appears when ggseqlogo package is installed today:
Error: ‘lazyeval’ has no export of the object’ f_eval ‘
The error
is caused by not installing the lazyeval package.
below is the specific code:
> Install. Packages (“G:/R language /R crawmer /R3.5 package /R3_5/lazyeval_0.2.1.zip”, repos = NULL, type = “win.binary”)
package ‘lazyeval’ unpacked and MD5 checked
> Library (“lazyeval”, lib.loc=”F:/R/ r-3.3.1 /library”)
Warning message:
Warning message:
library(“lazyeval”, lib.loc=”F:/R/ r-3.3.1 /library”)
Library (“ggseqlogo”, lib.loc=”F:/R/ r-3.3.1 /library”)
Warning message:
Warning message:
package “ggseqlogo” was built in R version 3.3.3
R language – error analysis – error in Call.graphics (C_ palette2, .Call(C_ palette2, NULL)) : invalid graphics state
problem description: plot, the error 01
> ggplot(religions_long,
+        aes(State, value, fill = variable)) +
+     geom_bar(stat = "identity") +
+     coord_flip()
> Error in .Call.graphics(C_palette2, .Call(C_palette2, NULL)) :
  invalid graphics state
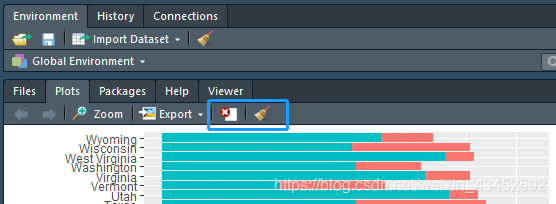
solution: maybe R can’t bear too much drawing, so empty all drawing will 
Renaming the column name of data frame in R language
Error type
Error: All arguments must be named
The use of rename in plyr is different from that in dplyr.
plyr::rename
rename(data, c(old=new))
dplyr::rename
rename(data, new = old)
Example
For example, the default is plyr’s rename. Run the following command, and an error will be reported :
d <- data.frame(old1=1:3, old2=4:6, old3=7:9)
d
library(tidyverse)
rename(d, c("old2"="two", "old3"="three"))
rename(d, c(old2="two", old3="three"))
result
> d <- data.frame(old1=1:3, old2=4:6, old3=7:9)
> d
  old1 old2 old3
1    1    4    7
2    2    5    8
3    3    6    9
> library(tidyverse)
> rename(d, c("old2"="two", "old3"="three"))
Error: All arguments must be named
> rename(d, c(old2="two", old3="three"))
Error: All arguments must be named
:
d <- data.frame(old1=1:3, old2=4:6, old3=7:9)
d
rename(d, two=old2, three=old3)
result:
> d <- data.frame(old1=1:3, old2=4:6, old3=7:9)
> d
  old1 old2 old3
1    1    4    7
2    2    5    8
3    3    6    9
> rename(d, two=old2, three=old3)
  old1 two three
1    1   4     7
2    2   5     8
3    3   6     9
Either
or with plyr modified in the first way :
d <- data.frame(old1=1:3, old2=4:6, old3=7:9)
d
library(tidyverse)
plyr::rename(d, c("old2"="two", "old3"="three"))
plyr::rename(d, c(old2="two", old3="three"))
result:
> d <- data.frame(old1=1:3, old2=4:6, old3=7:9)
> d
  old1 old2 old3
1    1    4    7
2    2    5    8
3    3    6    9
> library(tidyverse)
> plyr::rename(d, c("old2"="two", "old3"="three"))
  old1 two three
1    1   4     7
2    2   5     8
3    3   6     9
> plyr::rename(d, c(old2="two", old3="three"))
  old1 two three
1    1   4     7
2    2   5     8
3    3   6     9
done!!!!!!
key points, dplyr is the new name in front, the old name is placed behind, and without quotes, not c(), more convenient!!
In addition, the select in dplyr can also select + the name, directly specifying the number of columns!!
d <- data.frame(old1=1:3, old2=4:6, old3=7:9)
d
select(d,one=1,three=3)
result:
> d <- data.frame(old1=1:3, old2=4:6, old3=7:9)
> d
  old1 old2 old3
1    1    4    7
2    2    5    8
3    3    6    9
> select(d,one=1,three=3)
  one three
1   1     7
2   2     8
3   3     9
R: error: package or namespace load failed for ‘rjava’:
question:
during the course of running R, you usually need to call rjava.dll to run the virtual environment. For example, when importing the package library(XLSX), an error occurs:
> Library (XLSX)
load required package: rJava
Error: package or namespace load failed for ‘rJava’ :
loadNamespace() calculate ‘rJava’. OnLoad failed,
call: inDL(x, as. Logical (local), as. Logical (now)…
error: unable to load Shared object ‘D:/Program Files (x86)/R/R – 3.4.2/library/rJava/libs/x64/rJava DLL’ :
LoadLibrary failure: can’t find the specified module.
Error: unable to load the program package ‘rJava’
. In this case, the JAVA class library rjava.dll is installed again after installing other software in the system, and the R running environment cannot call the confirmation item. Rjava.dll:
> Sys. The setenv (JAVA_HOME = “D:/Program Files (x86)/Java/jdk1.8.0 _144/jre ‘)
> run library(XLSX) again, and you’re done!
> Library (XLSX)
load needed packages: rJava
load needed packages: xlsxjars
geom_ Warning message: sign function’s own error
was made by two mistakes, one day —- in memory of myself, stupid, angry to death
the first stupid mistake is
**Computation failed in `stat_signif()`:not enough 'y' observations**
this tells “Y” that’s not right,,,,,, this error is the most stupid
this error is looking for different,,,,,,
this is my error, maybe the same error but the error is different
compaired <- list(c("A主枝","A侧枝"),
                           c("B主枝","B侧枝"),
                           c("C主枝","C测枝"),
                           c("D主枝","D侧枝"),
                           c("E主枝","E侧枝"),
                           c("F主枝","F侧枝"))
second error
Warning message:Removed 12 rows containing missing values (geom_signif).
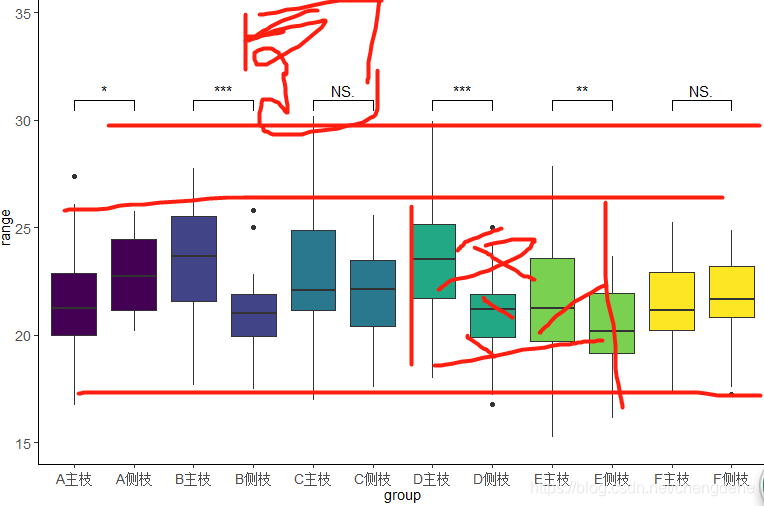
and the reason why I made this error is because I wrote the y range wrong, so all the y values are in this range, but when you set the comparison,
geom_signif(comparisons = compaired,map_signif_level = T,test =t.test,step_increase = 0.0)
step_increase = 0.0 when it is not 0, it will also occupy a certain range of Y-axis, so y needs to be expanded
**
the third – — geom_signif function will not draw the histogram difference analysis directly between groups
**
— of course, the current understanding is not possible, I hope to know to tell you, of course, if you use the function after adding significance is possible, draw directly, like,,,,,
so I chose the boxplot, it is also good
** purpose: ** to compare whether there is a significant difference between the two data under each LABLE
LABLE
data reading
##install.packages("ggplot2")
library("ggplot2")
##install.packages("ggsignif")
library(ggsignif)
##读取数据
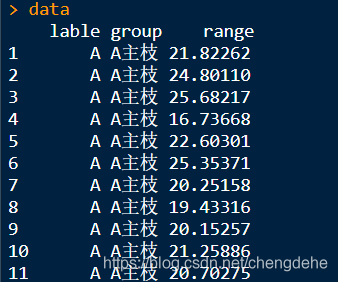
data <- read.table("clipboard",sep="\t",header = T,check.names=F)
dim(data)
data[1:5,1:3]

lable is divided into five classes group which is divided into two classes, to perform the difference significant comparison among each A, B, C and D

data type conversion
###转化因子
data$group <-factor(data$group,levels = unique(data$group),ordered = T)
data$lable <-factor(data$lable,levels = unique(data$lable),ordered = T)
##转换数值
data$range <- as.numeric(data$range)
division of the comparison group
compaired <- list(c("A主枝","A侧枝"),
                  c("B主枝","B侧枝"),
                  c("C主枝","C测枝"),
                  c("D主枝","D侧枝"),
                  c("E主枝","E侧枝"),
                  c("F主枝","F侧枝"))
was just used here, comparison of main and measured branches under different lable
+ A, B is for better comparison
Draw
p <- ggplot(data, aes(group, range,fill =lable)) +
      ###设置坐标,和分组
     geom_boxplot(show.legend = FALSE) +
     ###show.legend = FALSE  去除图例
     ylim(10, 40) +
     ##设置坐标轴Y的范围
     geom_signif(comparisons = compaired,map_signif_level = T,test =t.test,step_increase = 0.0)+
     ##geom_signif标注显著性——具体含义可以百度此函数
      ## wilcox.test——两种T测验根据正太检验决定
     theme_classic()+
     theme(axis.text.x=element_text(angle = 0,vjust =0.5,size=10.5),axis.text.y=element_text(size=10.5))+
     theme(axis.title.x =element_text(size=10.5), axis.title.y=element_text(size=10.5))
     ###设置刻度和标签字体等
p
