1. First check the test environment
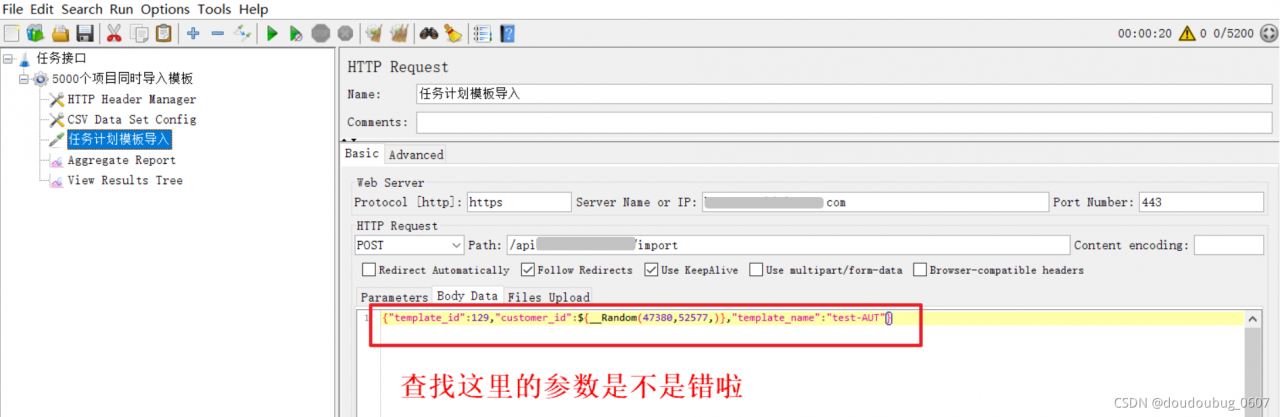
2. Check the test script for problems, such as the failure of the previous request and the error caused by the subsequent request
3. Niginx work_Connection configuration
4. Due to system limits open files restrictions
One. When the number of threads under pressure test is too large, or the threads are not released in time, the open TCP/IP connection port of the system has reached the maximum limit, and JMeter will directly report an error
[error message]: java.net.bindexception: address ready in use.
[cause analysis]: Windows provides 1024-5000 ports for TCPIP connection, and it takes about four minutes to recycle, which leads to that when we frequently call a large number of requests in a short time, the port will be full.
[solution]:
1. Open the registry: CMD (Win + R) enter regedit to open the registry;
2. Set the system parameter: the maximum number of port connections.
① find the system parameter setting item: \hkey_local_machine\system\currentcontrolset\services\TCPIP\parameters
② right click parameters to add a new DWORD with the parameter name maxuserport;
③ double click maxmaxuserport, and the entered value is 65534 Select decimal
④ restart the computer! Restart the computer! Restart the computer
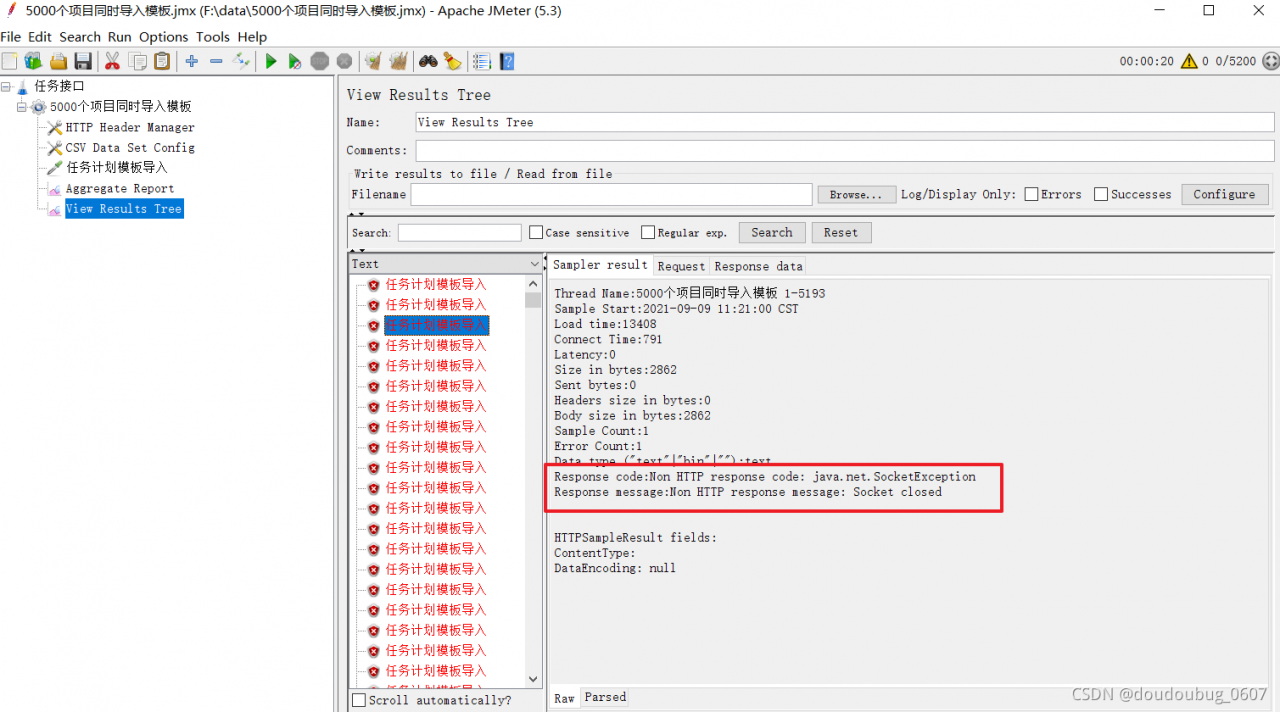
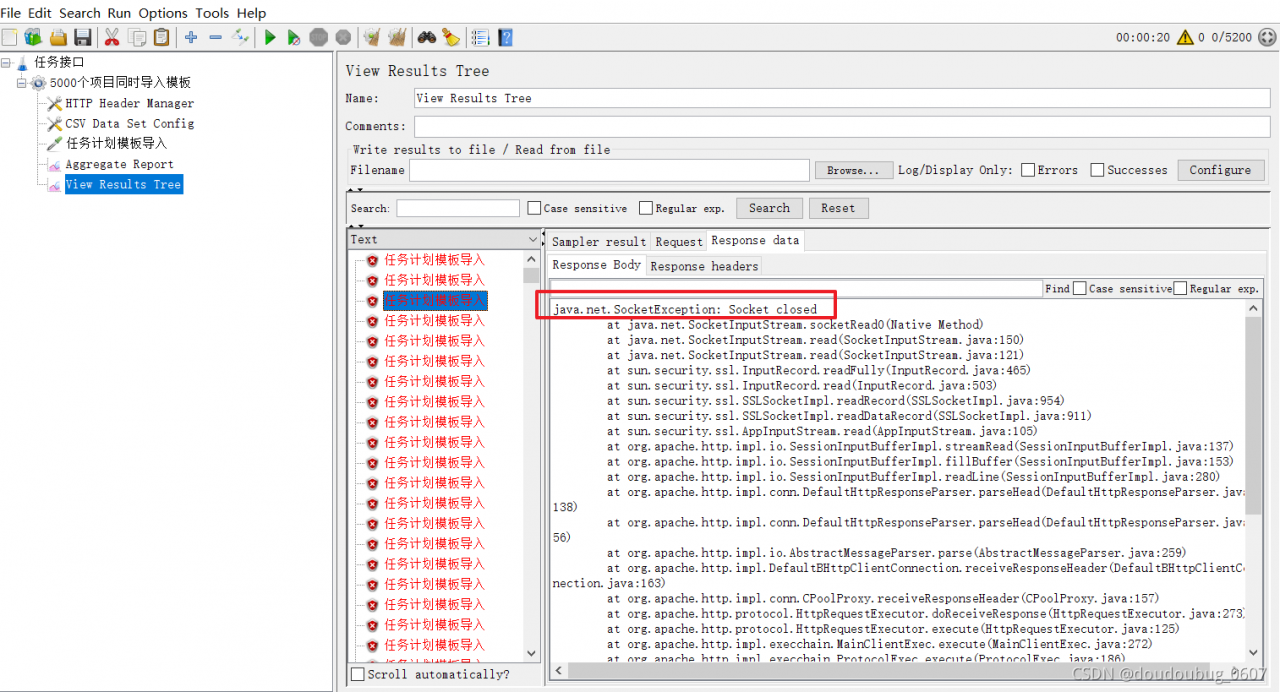
2. Socket closed
[cause analysis]: the number of threads has reached the bottleneck.
[solution]
1. When creating a thread in a loop, check keep alive to reuse the thread
2. Expand the thread pool size of the program under test. (when the program has a bottleneck)
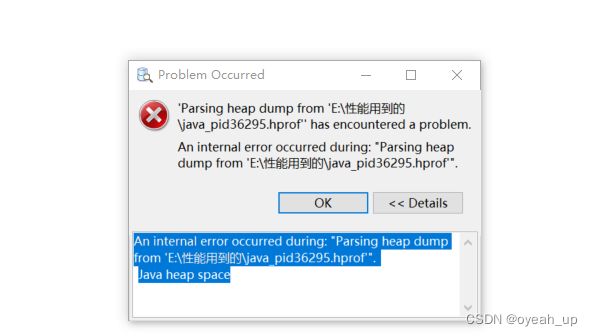
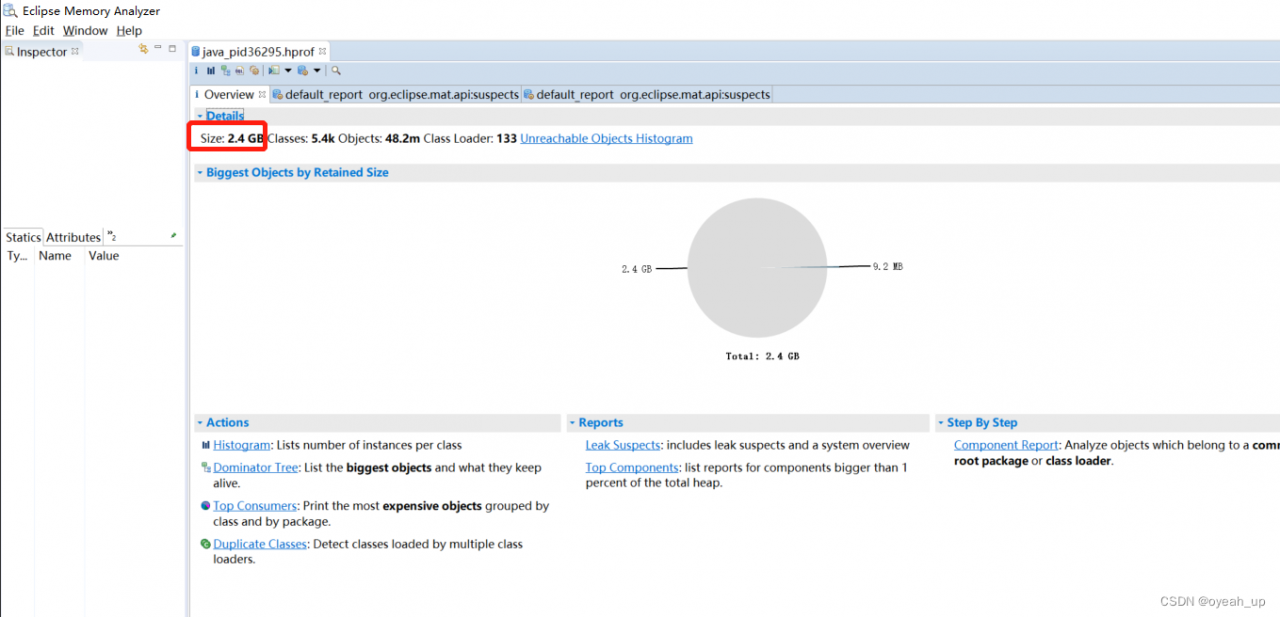
III. insufficient memory
[exception]: a large number of. Hprof files are generated in the JMeter installation directory.
[cause analysis]: the generation of such. Hprof files is caused by memory leakage.
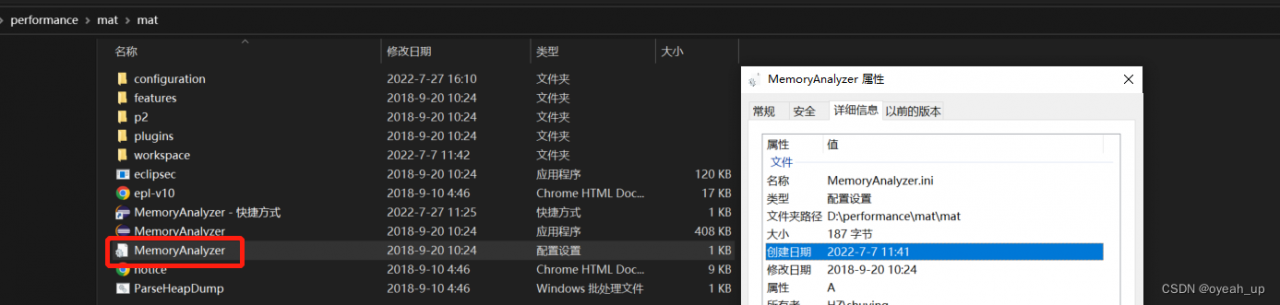
[solution]:
1. Upgrade the hardware configuration of JMeter pressure measuring machine to increase memory space
2. Modify the system parameters of JMeter
① open JMeter Bat file
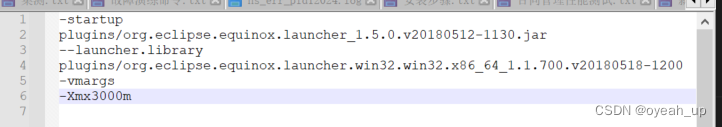
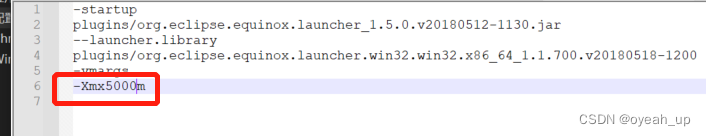
② modify the memory usage size of JMeter pressure tester:
set heap = – xms3g – xmx3g – XX: maxmetaspacesize = 768m (1g by default, modified to 3G)
3. Detect the tested program and find out whether there is memory leakage in the tested software program.
IV. bandwidth bottleneck
[phenomenon]: a large number of request timeouts occur in JMeter execution results, but the server of the tested program does not have error protection log.
[analysis]: it may be that the bandwidth of the master computer has reached the bottleneck.
[solution]:
1. Upgrade the hardware configuration of the main control computer and expand the bandwidth value, such as from 100MB → 500MB
2. Divide multiple main controllers equally to avoid too many remote actuators of a single main controller. It is best to control within 10
distributed testing has some basic limitations. The following items are mentioned in the official documents:
1. RMI cannot communicate across subnets without an agent; Therefore, during distributed pressure measurement, all actuators of JMeter should be placed in the same network segment
2. Starting from version 2.9, JMeter sends all test results of stripping response data to the console, which can reduce the impact on network io. Ensure that network traffic is monitored to avoid traffic contention
3. When a single JMeter client runs on a host with a 2-3 GHz CPU, it can process 1000-2000 threads, depending on the type of test
(this also depends on the complexity of the business process. If a long connection is involved in the business process, the measured single JMeter client can only better support 800-1000 threads)
VI. it is recommended to
restart the piezoelectric machine regularly, and it is best to restart the computer before each pressure test.
regularly clean the log file generated by JMeter: jmeter.log & jmeter-server.log (under the installation directory).
during distributed deployment, it is better for one master computer to control only less than 10 executors to avoid the bottleneck of bandwidth and memory of the master computer.
during pressure measurement, it is necessary to monitor the resource usage of CPU, memory, network and IO of the lower pressure measurement machine.