Tag Archives: Machine learning

torch.max Example (How to Use)

torch.max(input, dim)

pred = torch.max(input, dim)

Returns the maximum value per row (dim = 1) or column (dim = 0).

_, pred = torch.max(input, dim)

Only the position of the maximum value in each row (dim = 1) or column (dim = 0) is returned.

Example:

import torch

# Construct a 5x3 randomly initialized matrix
x = torch.rand(5, 3)
print('input: ', x)
print('-'*10)
y1 = torch.max(x, 1)
print('max by row: ', y1)
print('-'*10)
y2 = torch.max(x, 0)
print('max by col: ', y2)
print('-'*10)
_, y3 = torch.max(x, 1)
print('max index by row: ', y3)
print('-'*10)
_, y4 = torch.max(x, 0)
print('max index by col: ', y4)

Output result:

input:  tensor([[0.5504, 0.3160, 0.2448],
        [0.8694, 0.3295, 0.2085],
        [0.5530, 0.9984, 0.3531],
        [0.2874, 0.1025, 0.9419],
        [0.0867, 0.4234, 0.8334]])
----------
max by row:  torch.return_types.max(
values=tensor([0.5504, 0.8694, 0.9984, 0.9419, 0.8334]),
indices=tensor([0, 0, 1, 2, 2]))
----------
max by col:  torch.return_types.max(
values=tensor([0.8694, 0.9984, 0.9419]),
indices=tensor([1, 2, 3]))
----------
max index by row:  tensor([0, 0, 1, 2, 2])
----------
max index by col:  tensor([1, 2, 3])

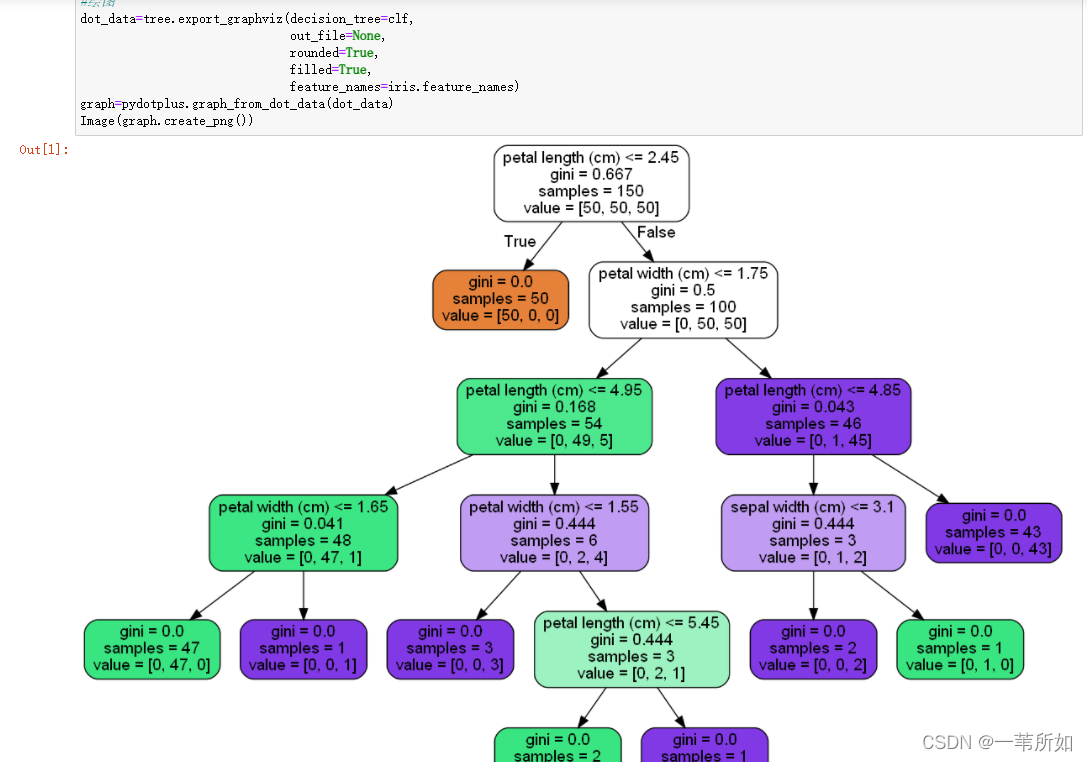
[Solved] Decision tree error: Graphviz’s executables not found

Decision tree code

from sklearn.datasets import load_iris
import pydotplus
from IPython.display import Image
from sklearn import tree
#Training Model
iris=load_iris()
clf=tree.DecisionTreeClassifier()
clf=clf.fit(iris.data,iris.target)

#Drawing
dot_data=tree.export_graphviz(decision_tree=clf,
                              out_file=None,
                              rounded=True,
                              filled=True,
                              feature_names=iris.feature_names)
graph=pydotplus.graph_from_dot_data(dot_data)
Image(graph.create_png())

Installation

Install pydotplus

pip install pydotplus

Running error: graphviz’s executables not found

Installing graphviz

pip install graphviz

Graphviz’s executables not found

After consulting the data, graphviz belongs to an independent software, which needs to be downloaded and installed on the official website

Website: http://www.graphviz.org/Download

Add environment variable

There are two methods, and the second one is recommended for personal test

Method 1: add the path of graphviz’s bin directory in environment variable.

Method 2: OS method

CMD

python

Enter Python environment

imoprt os
os.environ["PATH"]+= os.pathsep+"C:/Program Files/Graphviz/bin"  # change to your path of Graphviz

Done!

Operation results

If it is used in jupyter notebook like me, you need to restart jupyter notebook

[Solved] matplotlib.units.ConversionError: Failed to convert value(s) to axis units: ‘LiR‘


solve the problem


No handles with labels found to put in legend.

Traceback (most recent call last):
  File "D:\ProgramData\Anaconda3\lib\site-packages\matplotlib\backends\backend_qt5.py", line 508, in _draw_idle
    self.draw()
  File "D:\ProgramData\Anaconda3\lib\site-packages\matplotlib\backends\backend_agg.py", line 388, in draw
    self.figure.draw(self.renderer)
  File "D:\ProgramData\Anaconda3\lib\site-packages\matplotlib\artist.py", line 38, in draw_wrapper
    return draw(artist, renderer, *args, **kwargs)
  File "D:\ProgramData\Anaconda3\lib\site-packages\matplotlib\figure.py", line 1709, in draw
    renderer, self, artists, self.suppressComposite)
  File "D:\ProgramData\Anaconda3\lib\site-packages\matplotlib\image.py", line 135, in _draw_list_compositing_images
    a.draw(renderer)
  File "D:\ProgramData\Anaconda3\lib\site-packages\matplotlib\artist.py", line 38, in draw_wrapper
    return draw(artist, renderer, *args, **kwargs)
  File "D:\ProgramData\Anaconda3\lib\site-packages\matplotlib\axes\_base.py", line 2647, in draw
    mimage._draw_list_compositing_images(renderer, self, artists)
  File "D:\ProgramData\Anaconda3\lib\site-packages\matplotlib\image.py", line 135, in _draw_list_compositing_images
    a.draw(renderer)
  File "D:\ProgramData\Anaconda3\lib\site-packages\matplotlib\artist.py", line 38, in draw_wrapper
    return draw(artist, renderer, *args, **kwargs)
  File "D:\ProgramData\Anaconda3\lib\site-packages\matplotlib\text.py", line 670, in draw
    bbox, info, descent = textobj._get_layout(renderer)
  File "D:\ProgramData\Anaconda3\lib\site-packages\matplotlib\text.py", line 276, in _get_layout
    key = self.get_prop_tup(renderer=renderer)
  File "D:\ProgramData\Anaconda3\lib\site-packages\matplotlib\text.py", line 831, in get_prop_tup
    x, y = self.get_unitless_position()
  File "D:\ProgramData\Anaconda3\lib\site-packages\matplotlib\text.py", line 813, in get_unitless_position
    x = float(self.convert_xunits(self._x))
  File "D:\ProgramData\Anaconda3\lib\site-packages\matplotlib\artist.py", line 180, in convert_xunits
    return ax.xaxis.convert_units(x)
  File "D:\ProgramData\Anaconda3\lib\site-packages\matplotlib\axis.py", line 1553, in convert_units
    f'units: {x!r}') from e
matplotlib.units.ConversionError: Failed to convert value(s) to axis units: 'LiR'
Traceback (most recent call last):
  File "D:\ProgramData\Anaconda3\lib\site-packages\matplotlib\axis.py", line 1550, in convert_units
    ret = self.converter.convert(x, self.units, self)
  File "D:\ProgramData\Anaconda3\lib\site-packages\matplotlib\category.py", line 52, in convert
    'Missing category information for StrCategoryConverter; '
ValueError: Missing category information for StrCategoryConverter; this might be caused by unintendedly mixing categorical and numeric data
The above exception was the direct cause of the following exception:
Traceback (most recent call last):
  File "D:\ProgramData\Anaconda3\lib\site-packages\matplotlib\backends\backend_qt5.py", line 508, in _draw_idle
    self.draw()
  File "D:\ProgramData\Anaconda3\lib\site-packages\matplotlib\backends\backend_agg.py", line 388, in draw
    self.figure.draw(self.renderer)
  File "D:\ProgramData\Anaconda3\lib\site-packages\matplotlib\artist.py", line 38, in draw_wrapper
    return draw(artist, renderer, *args, **kwargs)
  File "D:\ProgramData\Anaconda3\lib\site-packages\matplotlib\figure.py", line 1709, in draw
    renderer, self, artists, self.suppressComposite)
  File "D:\ProgramData\Anaconda3\lib\site-packages\matplotlib\image.py", line 135, in _draw_list_compositing_images
    a.draw(renderer)
  File "D:\ProgramData\Anaconda3\lib\site-packages\matplotlib\artist.py", line 38, in draw_wrapper
    return draw(artist, renderer, *args, **kwargs)
  File "D:\ProgramData\Anaconda3\lib\site-packages\matplotlib\axes\_base.py", line 2647, in draw
    mimage._draw_list_compositing_images(renderer, self, artists)
  File "D:\ProgramData\Anaconda3\lib\site-packages\matplotlib\image.py", line 135, in _draw_list_compositing_images
    a.draw(renderer)
  File "D:\ProgramData\Anaconda3\lib\site-packages\matplotlib\artist.py", line 38, in draw_wrapper
    return draw(artist, renderer, *args, **kwargs)
  File "D:\ProgramData\Anaconda3\lib\site-packages\matplotlib\text.py", line 670, in draw
    bbox, info, descent = textobj._get_layout(renderer)
  File "D:\ProgramData\Anaconda3\lib\site-packages\matplotlib\text.py", line 276, in _get_layout
    key = self.get_prop_tup(renderer=renderer)
  File "D:\ProgramData\Anaconda3\lib\site-packages\matplotlib\text.py", line 831, in get_prop_tup
    x, y = self.get_unitless_position()
  File "D:\ProgramData\Anaconda3\lib\site-packages\matplotlib\text.py", line 813, in get_unitless_position
    x = float(self.convert_xunits(self._x))
  File "D:\ProgramData\Anaconda3\lib\site-packages\matplotlib\artist.py", line 180, in convert_xunits
    return ax.xaxis.convert_units(x)
  File "D:\ProgramData\Anaconda3\lib\site-packages\matplotlib\axis.py", line 1553, in convert_units
    f'units: {x!r}') from e
matplotlib.units.ConversionError: Failed to convert value(s) to axis units: 'LiR'

Error:
matplotlib.units.Conversion error: failed to convert value to axis unit: ‘LiR’

Solution:
matplotlib version is low, update the matplotlib library to version 3.3.2 or higher!
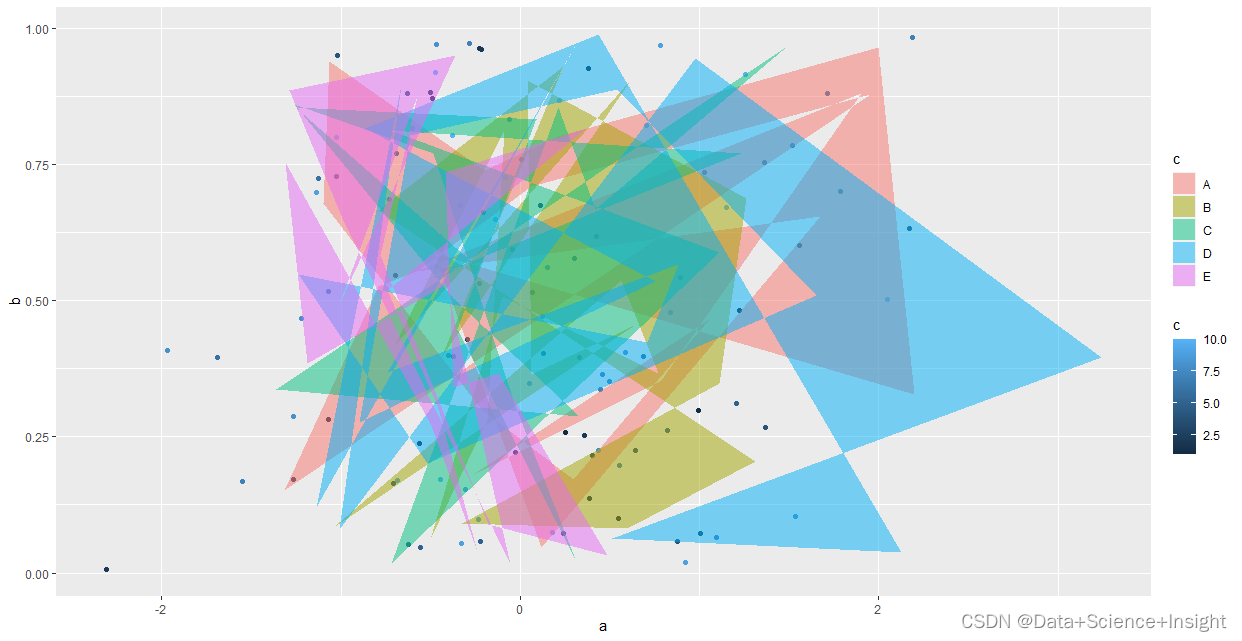
[Solved] R Language Error: Discrete value supplied to continuous scale

Error: discrete value supplied to continuous scale

#Simulation data

set.seed(123)
my_df1 <- data.frame(a=rnorm(100), b=runif(100), c=rep(1:10, 10))
my_df2 <- data.frame(a=rnorm(100), b=runif(100), c=factor(rep(LETTERS[1:5], 20)))

#Error: Discrete value supplied to continuous scale

ggplot() +
  geom_point(data=my_df1, aes(x=a, y=b, color=c)) +
  geom_polygon(data=my_df2, aes(x=a, y=b, color=c), alpha=0.5)

#Solution:

Use the fill parameter;

ggplot() +
  geom_point(data=my_df1, aes(x=a, y=b, color=c)) +
  geom_polygon(data=my_df2, aes(x=a, y=b, fill=c), alpha=0.5)

[Solved] Neo4j error: Import-Module & neo4j Neo.ClientError.Security.Unauthorized

Error reporting record

1. Import module: failed to load the specified module. Solution:

Solution: find the neo4j PS1 file in the bin directory, open it, find the import module, and change the relative path to the absolute path, that is,

"D:\Neo4j\neo4j-community-3.5.25\bin\Neo4j-Management.psd1"

2. When changing the password, neo4j Neo.ClientError.Security.Unauthorized

Solution: open neo4j.conf in the conf folder and delete the comment in front of #dbms.security.auth_enabled=false

[Solved] graphviz Error: failed to execute [‘dot’, ‘-Tsvg’], make sure the Graphviz executables are on your systems’ PATH


graphviz error: failed to execute [‘dot’, ‘-Tsvg’], make sure the Graphviz executables are on your systems’ PATH

1. Download graphviz

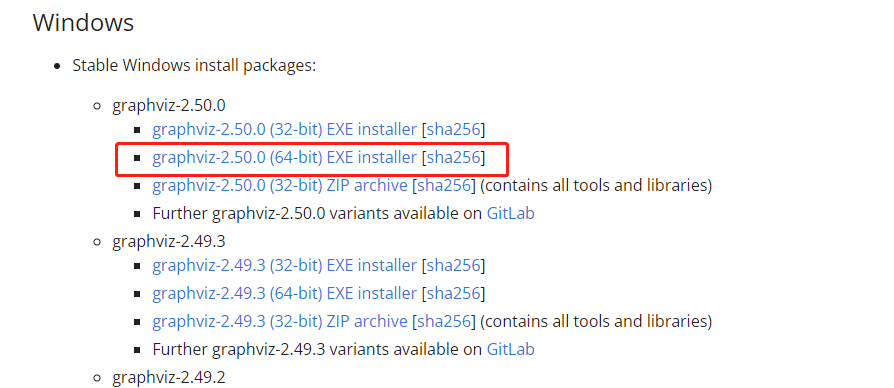
Go to https://graphviz.org/download/ to download graphviz (64-bit system must choose 64-bit Installer, can not choose ZIP)

2. Installation

In the following interface, you must select the red option (if not selected, you can only manually add environment variables later), and then you can finish all the way.

3. Test

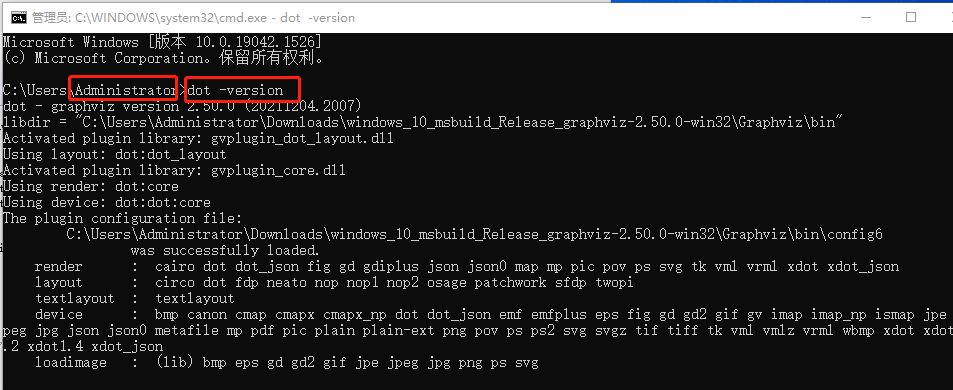
win + R, type cmd, open the cmd window, use dot -version test, can display the version information is installed successfully
(Do not blindly open CMD, if the open is C:\WINDOWS\system32> that can not be measured)

Note: if not, restart anaconda.

TensorFlow-gpu Error: failed call to cuInit: CUDA_ERROR_NO_DEVICE: no CUDA-capable device is detected

Error Messages:

failed call to cuInit: CUDA_ERROR_NO_Device: no CUDA capable device is detected
this is also what I encountered when running a CNN SVM classifier program of tensorflow GPU today. It’s not the problem of the program. It’s our graphics card.

Solution:

import tensorflow as tf

config = tf.compat.v1.ConfigProto()
config.gpu_options.allow_growth = True
session = tf.compat.v1.InteractiveSession(config=config)

Just add these lines of code to the head of the code, and you don’t need to write this code belowos.environ['CUDA_VISIBLE_DEVICES'] = '/gpu:0'

[Solved] Error: package or namespace load failed for ‘ggplot2’ in loadNamespace(i, c(lib.loc, .libPaths()), v

Error Messages:
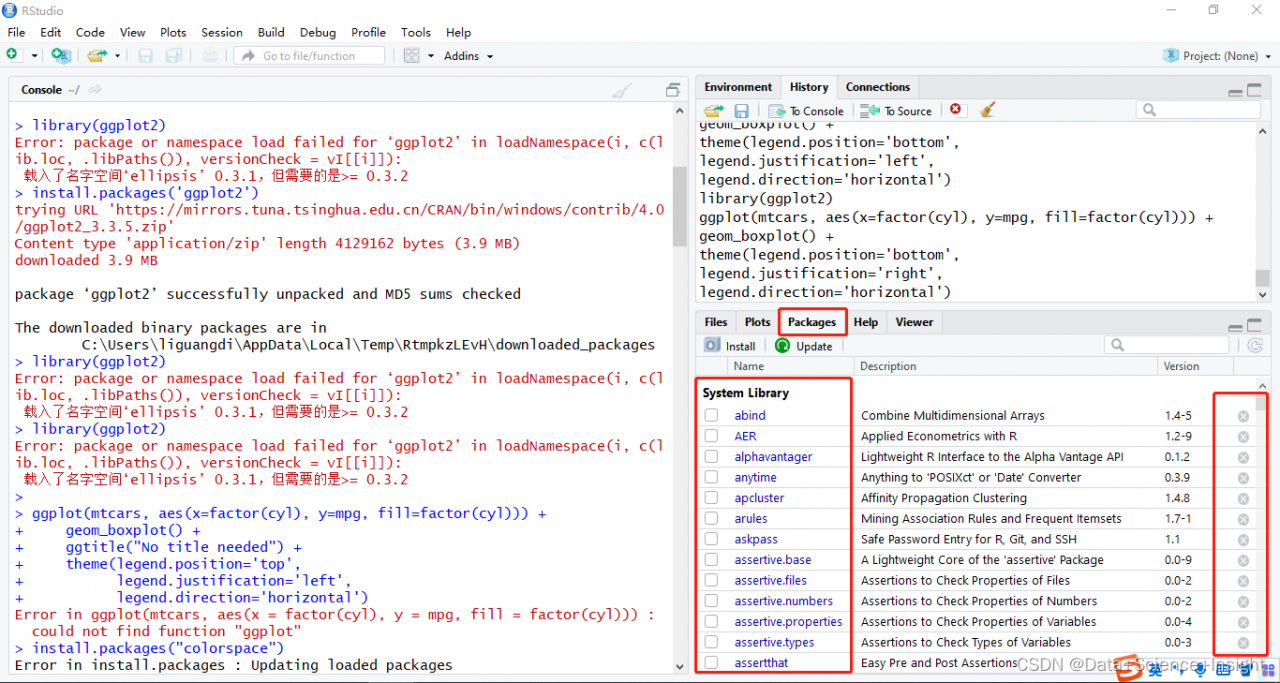
> library(ggplot2)
Error: package or namespace load failed for ‘ggplot2’ in loadNamespace(i, c(lib.loc, .libPaths()), versionCheck = vI[[i]]):

Loaded namespace ‘ellipsis’ 0.3.1, but what is needed is >= 0.3.2

Solution:
In Rstudio, find the packages module, remove the package that reported the error and then re-install it using install.packages for the corresponding installation.

[Solved] Python Pandas Read Error: OSError: initializing from file failed

Problem Description:

error when loading CSV format data in pandas

B = pd.read_csv("C:/Users/hp/Desktop/Hands-On Data Analysis/Unit 1 Project Collection/train.csv")
B.head(3)

report errors:

OSError: Initializing from file failed

Cause analysis:

When calling the read_csv() method of pandas, the C engine is used as the parser engine by default, and when the file name contains Chinese, using the C engine will be wrong in some cases.


Solution:

Specify the engine as Python when calling the read_csv() method

B = pd.read_csv("C:/Users/hp/Desktop/Hands-On-Data-Analysis/Unit-1-Project-Collection/train.csv",engine='python')
B.head(3)

[Solved] Pyg load dataset Error: attributeerror [pytorch geometry]

AttributeError: ‘GlobalStorage’ object has no attribute ‘train_mask’ Solution

 def create_masks(data):
    """
    Splits data into training, validation, and test splits in a stratified manner if
    it is not already splitted. Each split is associated with a mask vector, which
    specifies the indices for that split. The data will be modified in-place
    :param data: Data object
    :return: The modified data
    """
    if not hasattr(data, "val_mask"):

        data.train_mask = data.dev_mask = data.test_mask = None

        for i in range(20):
            labels = data.y.numpy()
            dev_size = int(labels.shape[0] * 0.1)
            test_size = int(labels.shape[0] * 0.8)

            perm = np.random.permutation(labels.shape[0])
            test_index = perm[:test_size]
            dev_index = perm[test_size:test_size + dev_size]

            data_index = np.arange(labels.shape[0])
            test_mask = torch.tensor(np.in1d(data_index, test_index), dtype=torch.bool)
            dev_mask = torch.tensor(np.in1d(data_index, dev_index), dtype=torch.bool)
            train_mask = ~(dev_mask + test_mask)

            test_mask = test_mask.reshape(1, -1)
            dev_mask = dev_mask.reshape(1, -1)
            train_mask = train_mask.reshape(1, -1)


            if data.train_mask is None:
                data.train_mask = train_mask
                data.val_mask = dev_mask
                data.test_mask = test_mask
            else:

                data.train_mask = torch.cat((data.train_mask, train_mask), dim=0)
                data.val_mask = torch.cat((data.val_mask, dev_mask), dim=0)
                data.test_mask = torch.cat((data.test_mask, test_mask), dim=0)

    else:  # in the case of WikiCS
        data.train_mask = data.train_mask.T
        data.val_mask = data.val_mask.T

    return data

AttributeError: 'GlobalStorage' object has no attribute 'train_mask'
Line 33: Change
if data.train_mask is None: to if 'train_mask' not in data:

[Solved] AttributeError: ‘DataParallel‘ object has no attribute ‘save‘

Error message:

trainer.model.save(self.dir, epoch, is_best=is_best)
AttributeError: 'DataParallel' object has no attribute 'save'

Source code analysis:

 trainer.model.save(self.dir, epoch, is_best=is_best)

The above code is the code before using single machine multi card parallel. My parallel code is implemented as follows:

os.environ["CUDA_VISIBLE_DEVICES"] = "3,2,1"
model = torch.nn.DataParallel(model,device_ids=[0,1]).cuda()

Cause analysis: attributeerror: ‘dataparallel’ object has no attribute ‘save‘

Under torch multi GPU training, the whole model is stored instead of the model state_Dict(), so we need to use model when calling model Module mode. After using the above modification method, the code is as follows:

 trainer.model.module.save(self.dir, epoch, is_best=is_best)

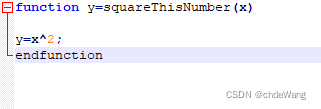
[Solved] octave Error: -error: ‘squareThisNumber‘ undefined near line 1 column 1

. M file name should also be capitalized: squarethisnumber m

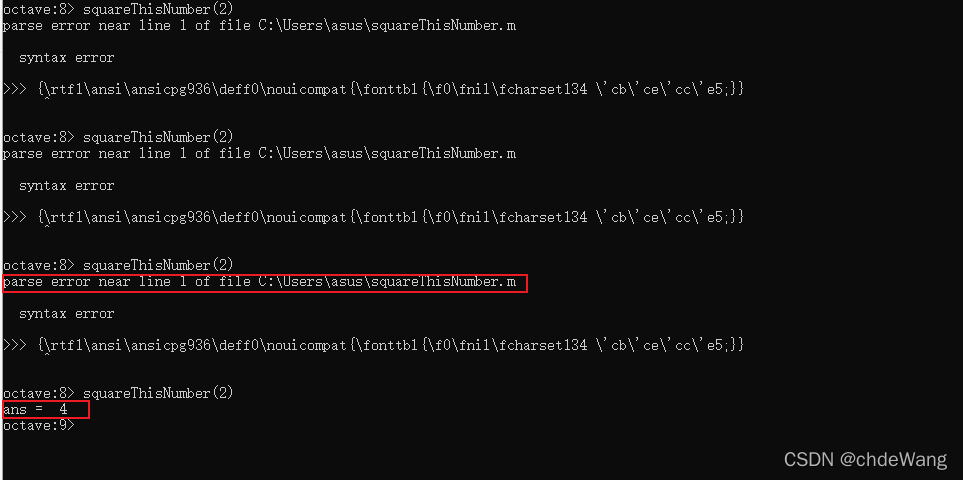
Question 2:

parse error near line 1 of file C:\Users\asus\squareThisNumber. m

syntax error

>>> {\rtf1\ansi\ansicpg936\deff0\nouicompat{\fonttbl{\f0\fnil\fcharset134 \’cb\’ce\’cc\’e5;}}

Solution: the WordPad program (nodepad) opens the file and finds many redundant characters. Delete them and add endfunction at the end.