Nagios is an open source software that can be used for network and infrastructure monitoring. Nagios will monitor servers, switches, applications and services. It alerts the System Administrator when something goes wrong and also alerts back when the issues has been rectified.
Using Nagios you can:
Monitor your entire IT infrastructure. Identify problems before they occur. Know immediately when problems arise. Share availability data with stakeholders. hypothetical questionDetect security breaches. Plan and budget for IT upgrades. Reduce downtime and business losses.
Scenario
In this tutorial i am going to use two systems as mentioned below.
Nagios server:
Operating system : Ubuntu 14.04 LTS Server
IP Address       : 192.168.1.250/24
Nagios client:
Operating System : Ubuntu 14.04 Desktop
IP Address       : 192.168.1.100/24
Prerequisites
Make sure your server have installed with fully working LAMP stack. If not, follow the below link to install LAMP server On Ubuntu 14.04 and earlier versions.
Install LAMP Server On Ubuntu 14.04
Install Nagios
Install nagios and nagios plugin using the following command:
sudo apt-get install nagios3 nagios-nrpe-pluginDuring installation, you’ll have to answer some simple questions. First, you’ll be asked to configure your mail server to get alerts from your nagios server.
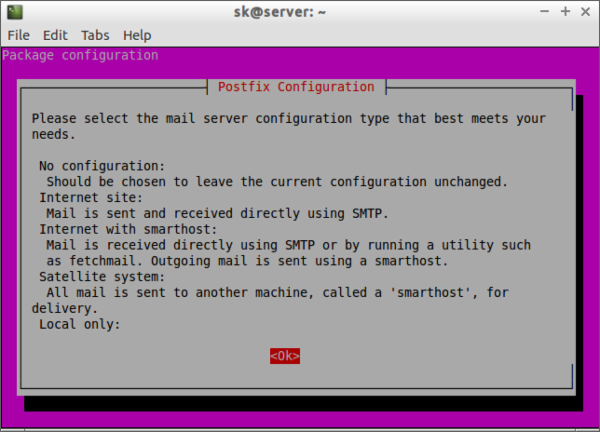
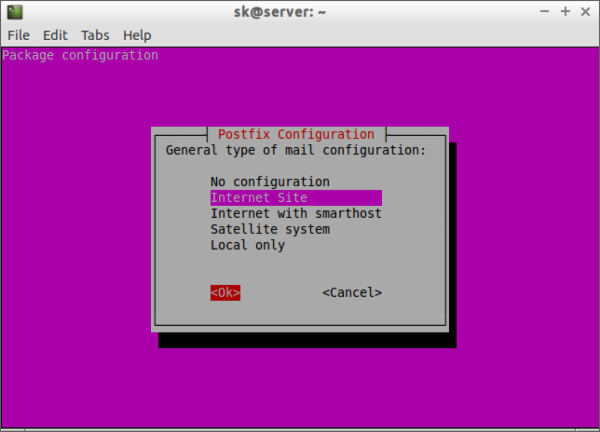
Select the type of mail configuration:
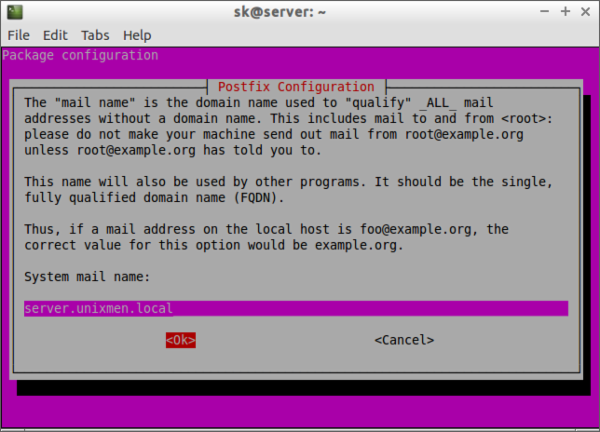
Enter the system mail name. It will be automatically selected by the installer. If not, enter it manually.
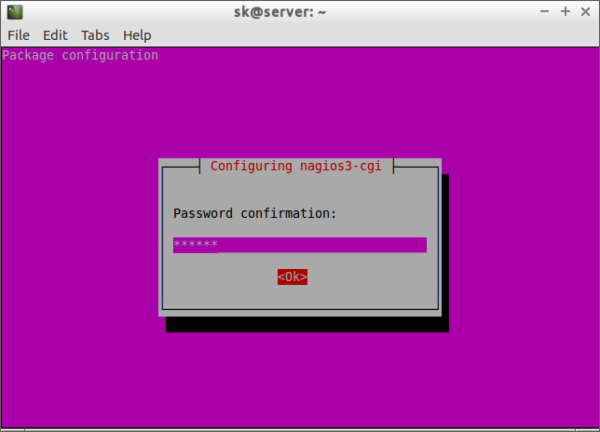
Enter the “nagiosadmin” password.
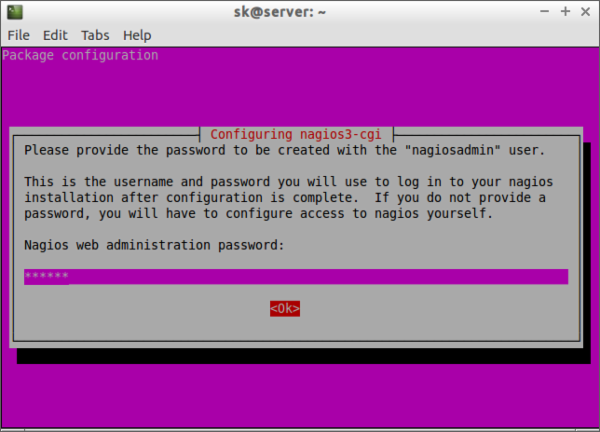
Re-enter the nagiosadmin password.
Configure Nagios
After nagios and nagios plugins installation, assign the permissions of www-data directory to nagios user, and set executable permission to the /var/lib/nagios3/ directory.
sudo usermod -a -G nagios www-data
sudo chmod -R +x /var/lib/nagios3/
By default, Nagios won’t check for external commands, just to be on the cautious side. If you want to be able to use the CGI command interface, you will have to enable this.
To do that, edit file /etc/nagios3/nagios.cfg ,
sudo nano /etc/nagios3/nagios.cfgFind the line,
check_external_commands=0
And change it to:
check_external_commands=1
Save and close the file. Restart nagios service.
sudo /etc/init.d/nagios3 restartAccess Nagios Web console
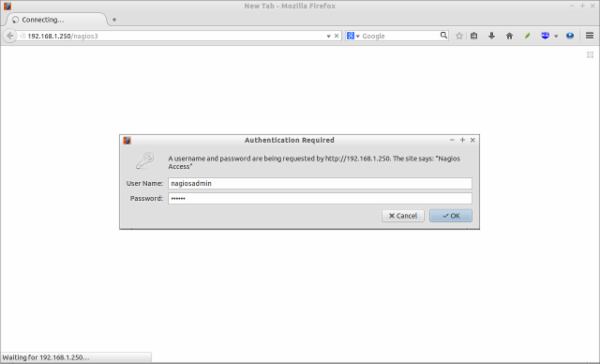
Open up the web browser and point it to http://ip-address/nagios3 . You’ll be asked to enter the username and password. Enter username as nagiosadmin and the password that you’ve created earlier.
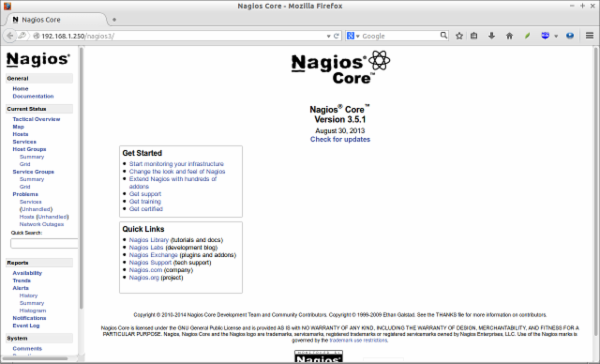
This is how my Nagios web console looked.
Click on the Hosts section on the left pane to list of hosts being monitored.
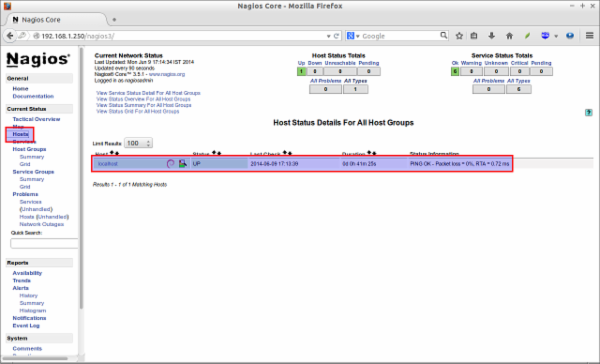
If you want to see the complete details of a monitoring hosts, click on the respective monitoring hosts in the above window.
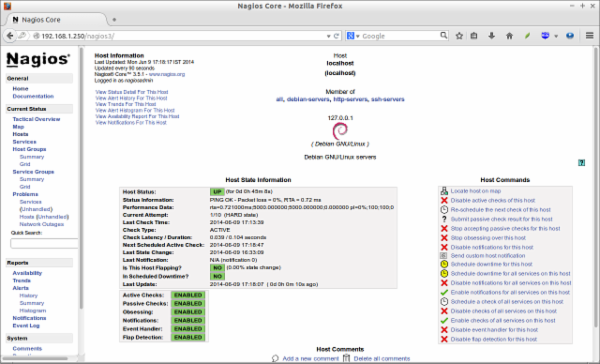
As you see in the above picture, the localhost(Nagios server) itself only is being monitored by default. We have to add the clients to monitor them now.
Add Monitoring targets
Now let us add some clients to monitor by Nagios server. To do that we have to install nrpe and nagios-plugins packages in our monitoring targets.
sudo apt-get install nagios-nrpe-server nagios-pluginsConfigure Monitoring targets
Edit /etc/nagios/nrpe.cfg file,
sudo nano /etc/nagios/nrpe.cfgAdd your Nagios server ip address:
[...]
allowed_hosts=127.0.0.1 192.168.1.100
[...]
Start/Restart nrpe service as shown below.
sudo /etc/init.d/nagios-nrpe-server restartNow, go back to your Nagios server to add the clients to be monitored through nagios server. By default, Debian based systems uses a configuration directory called /etc/nagios3/conf. d/ where nagios3-common, other packages and the local admin can dump or link all object configuration files into.
In the object configuration files, you can define hosts, host groups, contacts, contact groups, services, etc. You can split your object definitions across several config files if you wish, or keep them all in a single config file.
Ex:
cfg_file=/etc/nagios3/objects/commands.cfg
cfg_file=/etc/nagios3/objects/contacts.cfg
cfg_file=/etc/nagios3/objects/timeperiods.cfg
cfg_file=/etc/nagios3/objects/templates.cfg
Also, You can tell Nagios to process all config files (with a .cfg extension) in a particular directory by using the cfg_dir directive.
In this tutorial, I will tell Nagios to process client config files in a particular directory.
Edit /etc/nagios3/nagios.cfg file,
sudo nano /etc/nagios3/nagios.cfgand uncomment the following line.
[...]
cfg_dir=/etc/nagios3/servers
Create a directory called servers under /etc/nagios3/ location.
sudo mkdir /etc/nagios3/serversCreate config file to the client to be monitored. In my case, I want to monitor my Ubuntu desktop which has IP address 192.168.1.100 , and hostname as sk .
sudo nano /etc/nagios3/servers/clients.cfgAdd the following lines:
define host{

use                             generic-host

host_name                       sk

alias                           sk

address                         192.168.1.100

max_check_attempts              5

check_period                    24x7

notification_interval           30

notification_period             24x7

}
Save and close the file.
Here, sk is my Ubuntu 14.04 client host name, and 192.168.1.100 is the IP address of my client.
Restart nagios service.
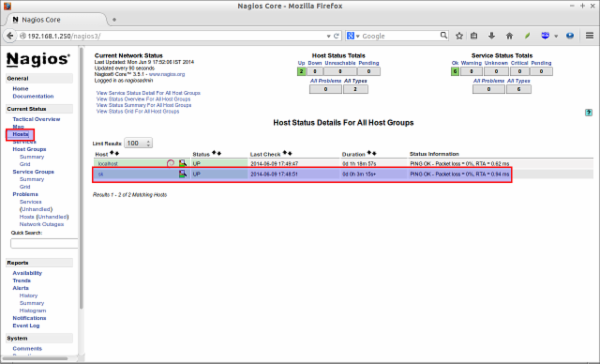
sudo /etc/init.d/nagios3 restartNow, open the nagios web console again in the browser and navigate to “Hosts” section in the left pane. You should see the newly added client will be visible there. Click on the host to see if there is anything wrong or alerts. Please note that you have to wait 90 seconds after any changes in your nagios server.
Click on the monitoring target, you’ll get the detailed output:
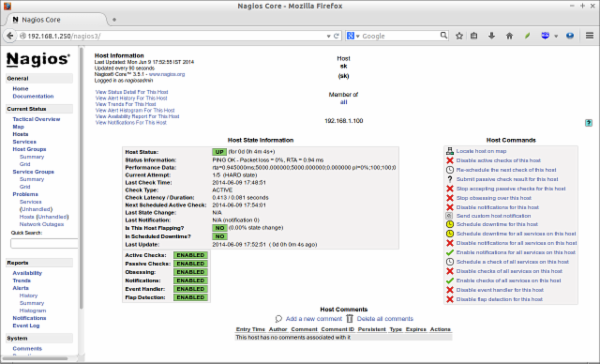
Like this way, you can define more clients by creating a separate config files /etc/nagios3/servers directory for each client.
Define services
We have defined the monitoring host before. Now let us add some services of the monitoring host. For example, to monitor the ssh service, add the following lines shown in red colour in the /etc/nagios3/servers/clients.cfg file.
sudo nano /etc/nagios3/servers/clients.cfgAdd the lines shown in red color:
define host{

use                             generic-host

host_name                       sk

alias                           sk

address                         192.168.1.100

max_check_attempts              5

check_period                    24x7

notification_interval           30

notification_period             24x7

}
define service {
        use                             generic-service
        host_name                       sk
        service_description             SSH
        check_command                   check_ssh
        notifications_enabled           0
        }
Save and close the file. Restart Nagios.
sudo /etc/init.d/nagios3 restartNow log in to Nagios web console and check for the added services. Navigate to Services section, you should see the ssh service will be available there.
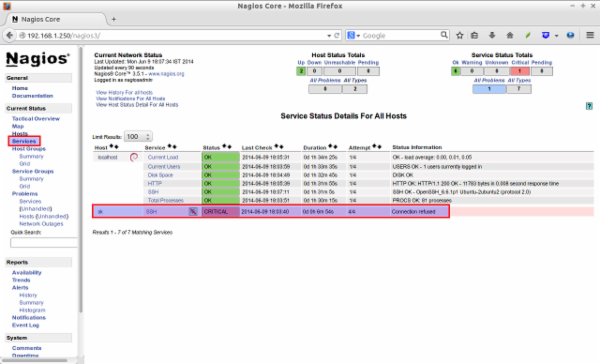
To know more about object definitions such as Host definitions, service definitions, contact definitions and more please do visit here . This page will describe you the description and format of all nagios object definitions.
That’s it. Happy Monitoring with Nagios!
Reference Links:
Nagios Homepage
Read More:
- How to manually upgrade Ubuntu 16.04 LTS to Ubuntu 18.04 LTS, Part I
- Howto Install and Configure VTK on Ubuntu
- centos nagios CHECK_NRPE: Error – Could not complete SSL handshake
- How to configure OpenGL with CodeBlocks in Ubuntu
- Dpkg: error processing package XXX (- – configure) solution (red warning in the upper right corner of Ubuntu)
- Configure glut in Ubuntu and implement basic OpenGL experiment on CodeBlocks platform
- Configure Java environment variables for Ubuntu with Zsh configuration
- Configure Nvidia graphics card on ubuntu18.04 xrandr Failed to get size of gamma for output default
- Microsoft Store install Ubuntu
- [Linux] failed to install libudev dev in Ubuntu 18.04
- Ubuntu 16.04 install Chinese input method
- [solution] install L2TP and related settings in Ubuntu 18.04
- How to install cuda10.01in Ubuntu18.04
- Install Java runtime JRE in Ubuntu 16.04
- How to install postman tool in Ubuntu 16.04
- NPM install error | gyp err! Configure error
- How to install scikit learn and other scientific computing libraries in Ubuntu 16.04
- NPM install error: gyp err! Configure error
- Ubuntu16.04 pip3 install PyAudio 出错:error: command ‘x86_64-linux-gnu-gcc’ failed with exit status 1
- Ubuntu 18.04/ubuntu 16.04 (Ubuntu kylin 18 / 16), the last grub installation failed