Category Archives: Python

[Solved] Decision tree error: Graphviz’s executables not found

Decision tree code

from sklearn.datasets import load_iris
import pydotplus
from IPython.display import Image
from sklearn import tree
#Training Model
iris=load_iris()
clf=tree.DecisionTreeClassifier()
clf=clf.fit(iris.data,iris.target)

#Drawing
dot_data=tree.export_graphviz(decision_tree=clf,
                              out_file=None,
                              rounded=True,
                              filled=True,
                              feature_names=iris.feature_names)
graph=pydotplus.graph_from_dot_data(dot_data)
Image(graph.create_png())

Installation

Install pydotplus

pip install pydotplus

Running error: graphviz’s executables not found

Installing graphviz

pip install graphviz

Graphviz’s executables not found

After consulting the data, graphviz belongs to an independent software, which needs to be downloaded and installed on the official website

Website: http://www.graphviz.org/Download

Add environment variable

There are two methods, and the second one is recommended for personal test

Method 1: add the path of graphviz’s bin directory in environment variable.

Method 2: OS method

CMD

python

Enter Python environment

imoprt os
os.environ["PATH"]+= os.pathsep+"C:/Program Files/Graphviz/bin"  # change to your path of Graphviz

Done!

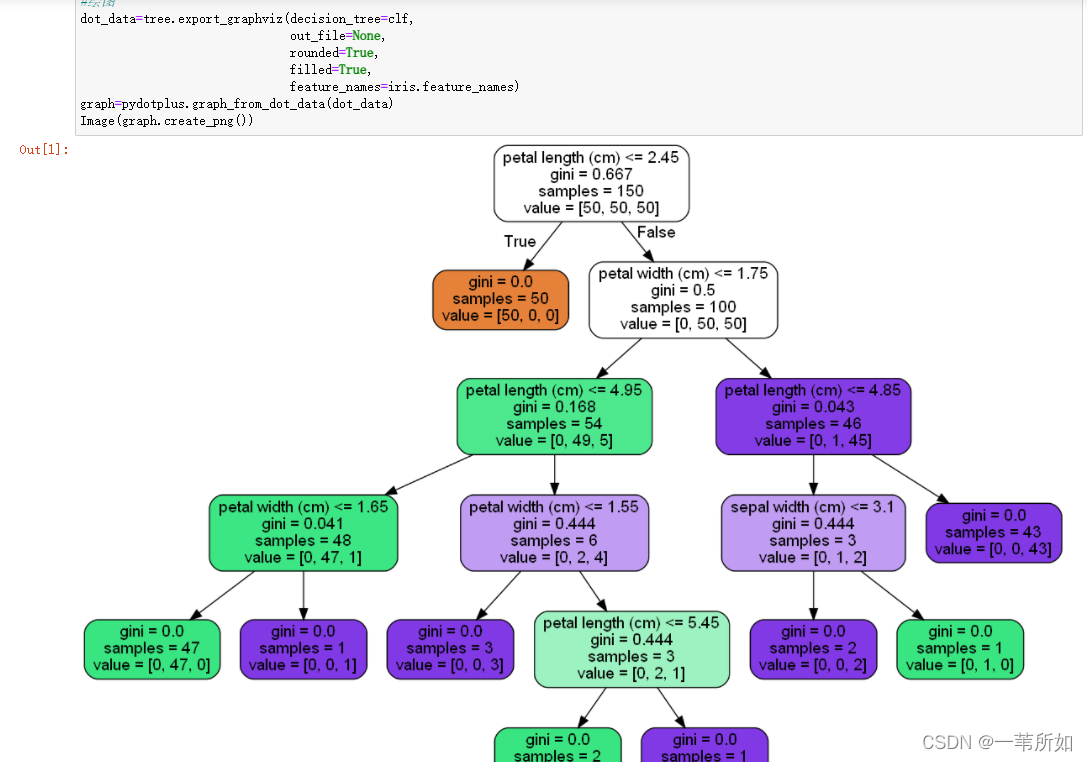
Operation results

If it is used in jupyter notebook like me, you need to restart jupyter notebook

How to Solve ModuleNotFoundError Error After pip-autoremove Installed

The pip-autoremove tool is very convenient for managing the dependencies in the environment, when uninstalling a Package, you can uninstall it together with the dependencies installed at that time. However, after version 0.10.0, using pip-autoremove will report an error:

pip-autoremove packege_name
> ModuleNotFoundError: No module named 'pip_autoremove'

This is because in this version, pip-autoremove is treated as a Module. now there is a new commit on github that fixes this problem, but at the moment the direct installation via pip still does not work. In this case, you can force the installation of the fixed version to solve the problem.

pip3 install --force git+https://github.com/imba-tjd/pip-autoremove@ups

[Solved] matplotlib.units.ConversionError: Failed to convert value(s) to axis units: ‘LiR‘


solve the problem


No handles with labels found to put in legend.

Traceback (most recent call last):
  File "D:\ProgramData\Anaconda3\lib\site-packages\matplotlib\backends\backend_qt5.py", line 508, in _draw_idle
    self.draw()
  File "D:\ProgramData\Anaconda3\lib\site-packages\matplotlib\backends\backend_agg.py", line 388, in draw
    self.figure.draw(self.renderer)
  File "D:\ProgramData\Anaconda3\lib\site-packages\matplotlib\artist.py", line 38, in draw_wrapper
    return draw(artist, renderer, *args, **kwargs)
  File "D:\ProgramData\Anaconda3\lib\site-packages\matplotlib\figure.py", line 1709, in draw
    renderer, self, artists, self.suppressComposite)
  File "D:\ProgramData\Anaconda3\lib\site-packages\matplotlib\image.py", line 135, in _draw_list_compositing_images
    a.draw(renderer)
  File "D:\ProgramData\Anaconda3\lib\site-packages\matplotlib\artist.py", line 38, in draw_wrapper
    return draw(artist, renderer, *args, **kwargs)
  File "D:\ProgramData\Anaconda3\lib\site-packages\matplotlib\axes\_base.py", line 2647, in draw
    mimage._draw_list_compositing_images(renderer, self, artists)
  File "D:\ProgramData\Anaconda3\lib\site-packages\matplotlib\image.py", line 135, in _draw_list_compositing_images
    a.draw(renderer)
  File "D:\ProgramData\Anaconda3\lib\site-packages\matplotlib\artist.py", line 38, in draw_wrapper
    return draw(artist, renderer, *args, **kwargs)
  File "D:\ProgramData\Anaconda3\lib\site-packages\matplotlib\text.py", line 670, in draw
    bbox, info, descent = textobj._get_layout(renderer)
  File "D:\ProgramData\Anaconda3\lib\site-packages\matplotlib\text.py", line 276, in _get_layout
    key = self.get_prop_tup(renderer=renderer)
  File "D:\ProgramData\Anaconda3\lib\site-packages\matplotlib\text.py", line 831, in get_prop_tup
    x, y = self.get_unitless_position()
  File "D:\ProgramData\Anaconda3\lib\site-packages\matplotlib\text.py", line 813, in get_unitless_position
    x = float(self.convert_xunits(self._x))
  File "D:\ProgramData\Anaconda3\lib\site-packages\matplotlib\artist.py", line 180, in convert_xunits
    return ax.xaxis.convert_units(x)
  File "D:\ProgramData\Anaconda3\lib\site-packages\matplotlib\axis.py", line 1553, in convert_units
    f'units: {x!r}') from e
matplotlib.units.ConversionError: Failed to convert value(s) to axis units: 'LiR'
Traceback (most recent call last):
  File "D:\ProgramData\Anaconda3\lib\site-packages\matplotlib\axis.py", line 1550, in convert_units
    ret = self.converter.convert(x, self.units, self)
  File "D:\ProgramData\Anaconda3\lib\site-packages\matplotlib\category.py", line 52, in convert
    'Missing category information for StrCategoryConverter; '
ValueError: Missing category information for StrCategoryConverter; this might be caused by unintendedly mixing categorical and numeric data
The above exception was the direct cause of the following exception:
Traceback (most recent call last):
  File "D:\ProgramData\Anaconda3\lib\site-packages\matplotlib\backends\backend_qt5.py", line 508, in _draw_idle
    self.draw()
  File "D:\ProgramData\Anaconda3\lib\site-packages\matplotlib\backends\backend_agg.py", line 388, in draw
    self.figure.draw(self.renderer)
  File "D:\ProgramData\Anaconda3\lib\site-packages\matplotlib\artist.py", line 38, in draw_wrapper
    return draw(artist, renderer, *args, **kwargs)
  File "D:\ProgramData\Anaconda3\lib\site-packages\matplotlib\figure.py", line 1709, in draw
    renderer, self, artists, self.suppressComposite)
  File "D:\ProgramData\Anaconda3\lib\site-packages\matplotlib\image.py", line 135, in _draw_list_compositing_images
    a.draw(renderer)
  File "D:\ProgramData\Anaconda3\lib\site-packages\matplotlib\artist.py", line 38, in draw_wrapper
    return draw(artist, renderer, *args, **kwargs)
  File "D:\ProgramData\Anaconda3\lib\site-packages\matplotlib\axes\_base.py", line 2647, in draw
    mimage._draw_list_compositing_images(renderer, self, artists)
  File "D:\ProgramData\Anaconda3\lib\site-packages\matplotlib\image.py", line 135, in _draw_list_compositing_images
    a.draw(renderer)
  File "D:\ProgramData\Anaconda3\lib\site-packages\matplotlib\artist.py", line 38, in draw_wrapper
    return draw(artist, renderer, *args, **kwargs)
  File "D:\ProgramData\Anaconda3\lib\site-packages\matplotlib\text.py", line 670, in draw
    bbox, info, descent = textobj._get_layout(renderer)
  File "D:\ProgramData\Anaconda3\lib\site-packages\matplotlib\text.py", line 276, in _get_layout
    key = self.get_prop_tup(renderer=renderer)
  File "D:\ProgramData\Anaconda3\lib\site-packages\matplotlib\text.py", line 831, in get_prop_tup
    x, y = self.get_unitless_position()
  File "D:\ProgramData\Anaconda3\lib\site-packages\matplotlib\text.py", line 813, in get_unitless_position
    x = float(self.convert_xunits(self._x))
  File "D:\ProgramData\Anaconda3\lib\site-packages\matplotlib\artist.py", line 180, in convert_xunits
    return ax.xaxis.convert_units(x)
  File "D:\ProgramData\Anaconda3\lib\site-packages\matplotlib\axis.py", line 1553, in convert_units
    f'units: {x!r}') from e
matplotlib.units.ConversionError: Failed to convert value(s) to axis units: 'LiR'

Error:
matplotlib.units.Conversion error: failed to convert value to axis unit: ‘LiR’

Solution:
matplotlib version is low, update the matplotlib library to version 3.3.2 or higher!
How to Solve no module fcntl Error in Windows

This library is specific to Linux, if you use this library in Windows system development, it will generate some errors, how to solve it?
Create a new fcntl.py file

DN_ACCESS = 1
DN_ATTRIB = 32
DN_CREATE = 4
DN_DELETE = 8
DN_MODIFY = 2
DN_MULTISHOT = 2147483648
DN_RENAME = 16

FASYNC = 8192

FD_CLOEXEC = 1

F_ADD_SEALS = 1033

F_DUPFD = 0

F_DUPFD_CLOEXEC = 1030

F_EXLCK = 4
F_GETFD = 1
F_GETFL = 3
F_GETLEASE = 1025
F_GETLK = 5
F_GETLK64 = 5
F_GETOWN = 9
F_GETSIG = 11

F_GET_SEALS = 1034

F_NOTIFY = 1026
F_RDLCK = 0

F_SEAL_GROW = 4
F_SEAL_SEAL = 1
F_SEAL_SHRINK = 2
F_SEAL_WRITE = 8

F_SETFD = 2
F_SETFL = 4
F_SETLEASE = 1024
F_SETLK = 6
F_SETLK64 = 6
F_SETLKW = 7
F_SETLKW64 = 7
F_SETOWN = 8
F_SETSIG = 10
F_SHLCK = 8
F_UNLCK = 2
F_WRLCK = 1

LOCK_EX = 2
LOCK_MAND = 32
LOCK_NB = 4
LOCK_READ = 64
LOCK_RW = 192
LOCK_SH = 1
LOCK_UN = 8
LOCK_WRITE = 128

def fcntl(fd, op, arg=0):
    return 0


def ioctl(fd, op, arg=0, mutable_flag=True):
    if mutable_flag:
        return 0
    else:
        return ""


def flock(fd, op):
    return


def lockf(fd, operation, length=0, start=0, whence=0):
    return

Just find your Python path and put it in

C:\Users\{Username}\AppData\Local\Programs\Python\Python38\Lib\fcntl.py

Done!

How to Solve Yolox Training C Disk Full Issue

0. Problem description: COCO dataset training to half suddenly interrupted, look at the C disk shows red, there is not much memory (training, generated in AppData/Temp in the temporary file too much)
As shown in the figure: as the epoch increases, the file is getting bigger and bigger (the figure is still yolox-tiny), if we use yolox-x, the C drive is directly full!

1. Problem Cause.
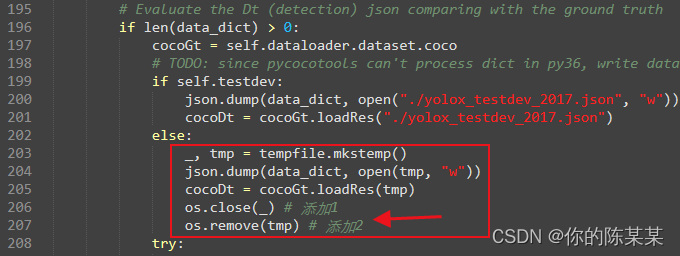
YOLOX-main/yolox/evaluators/coco_evaluator.py in line 203 or so **tempfile.mkstemp()** after creating the file, no close() and remove() operations are performed
The following figure.

2. Solution methods
(1) Method 1
As shown above, add os.close(_) and os.remove(tmp) two lines of code, directly delete the file just created after use. Note: import os module at the beginning]
(2) Method 2
The problem is already known, you can use with…as… to create, automatically delete and close the file.
(3) Method 3
If you want to keep each temporary file, and do not want to C drive blow up, then directly change the save location to a custom path.
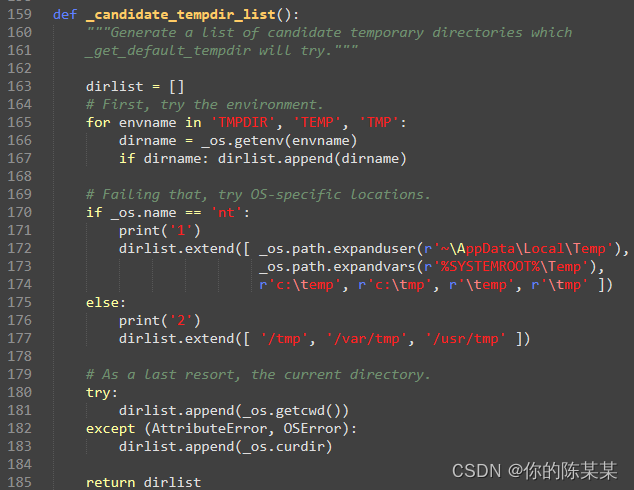
Code location: Anoconda/envs/using-environment/Lib/tempfile.py in line 159-185.
directly change the direct dirlist operation to the user-defined folder location, as follows:

(4) Method 4
Manually clean up files in temp at regular intervals
Note: VOC format dataset training, no temporary files are generated because it uses the with…as… file creation method. For details, please refer to the end of voc_evaluater.py

[Solved] MindSpore Error: “operation does not support the type kMetaTypeNone“

Environment:
Hardware Environment(Ascend/GPU/CPU): All
Software Environment:
MindSpore version (source or binary): 1.6.0 & Earlier versions
Python version (e.g., Python 3.7.5): 3.7.6
OS platform and distribution (e.g., Linux Ubuntu 16.04): Ubuntu
GCC/Compiler version (if compiled from source): gcc 9.4.0
python code examples

from mindspore import nn

class Net(nn.Cell):
    def __init__(self):
        super(Net, self).__init__()

    def construct(self, x):
        return self.y + x

net = Net()
output = net(1)

Error reporting information

Traceback (most recent call last):
  File "test_self.py", line 11, in <module>
    output = net(1)
  File "mindspore\nn\cell.py", line 477, in __call__
    out = self.compile_and_run(*args)
  File "mindspore\nn\cell.py", line 803, in compile_and_run
    self.compile(*inputs)
  File "mindspore\nn\cell.py", line 790, in compile
    _cell_graph_executor.compile(self, *inputs, phase=self.phase, auto_parallel_mode=self._auto_parallel_mode)
  File "mindspore\common\api.py", line 632, in compile
    result = self._graph_executor.compile(obj, args_list, phase, self._use_vm_mode())
RuntimeError: mindspore\ccsrc\frontend\operator\composite\multitype_funcgraph.cc:162 GenerateFromTypes] The 'add' operation does not support the type [kMetaTypeNone, Int64].
The supported types of overload function `add` is: [Tuple, Tuple], [RowTensor, Tensor], [Tensor, Tensor], [List, List], [Tensor, List], [List, Tensor], [String, String], [Tuple, Tensor], [kMetaTypeNone, kMetaTypeNone], [Number, Number], [Number, Tensor], [Tensor, Number], [Tensor, Tuple].

The function call stack (See file 'rank_0/om/analyze_fail.dat' for more details):
# 0 In file test_self.py(8)
        return self.y + x


Solution:

Since the execution error is caused by using an undefined variable, the solution is to define the variable in the network’s initialization function __init__(self):. Note that only variables defined as members of self can be used in the construct(self, x) method.

from mindspore import nn

class Net(nn.Cell):
    def __init__(self):
        super(Net, self).__init__()
        self.y = 1.0

    def construct(self, x):
        return self.y + x

net = Net()
output = net(1)

If you write self.y = 1.0 instead of y = 1.0, you will also get an error because the variable is undefined.

Python Error: OSError: cannot open resource [How to Solve]

Question:

  File "D:\Windows_DL_Environment\anaconda3\envs\py37\lib\site-packages\PIL\ImageFont.py", line 852, in freetype
    return FreeTypeFont(font, size, index, encoding, layout_engine)
  File "D:\Windows_DL_Environment\anaconda3\envs\py37\lib\site-packages\PIL\ImageFont.py", line 212, in __init__
    font, size, index, encoding, layout_engine=layout_engine
OSError: cannot open resource

This class is a common font problem. In Windows environment, fonts are generally located in the C:\windows\fonts folder. In this folder, users can check whether the font specified in the python program exists.

fnt = ImageFont.truetype('Pillow/Tests/fonts/FreeMono.ttf', 50)

Solution 1:

Change the font that exists on the computer

ImageFont.truetype("Pillow/Tests/fonts/arial.ttf", 50)

Solution 2:

Found no freemono in the computer Ttf font, so you need to download
https://fontmeme.com/ziti/freemono-font/

After downloading, unzip it into the fonts folder

finally. Restart the computer to execute.

[Solved] Pychart breakpoint error: frames are not available

Today when I use pycharm again, the problem of frames are not available after setting the menu bar File->Settings->Editor->File Encodings


Modify Project Encodind to UTF-8, but still not, then menu bar File->Settings->Build,Execution,Deployment->Python Debugger


I unchecked PyQt compatible, but it didn’t work. Finally, I hit a few more breakpoints on the code to solve the problem.

[Solved] AttributeError WriteOnlyWorksheet object has no attribute cell

#Importing the openpyxl module
import openpyxl

## Create a workbook##
#1. Create a workbook
workbook=openpyxl.Workbook('.. /Excel_Data/data1.xlsx')
#2. create a sheet page (form)
sheet_name=workbook.create_sheet('sheet1')
#3. Write a data
sheet_name.cell(row=2,column=2,value="data written")
#4. Save
workbook.save('../Excel_Data/data1.xlsx')

Error in execution result:

AttributeError: ‘WriteOnlyWorksheet’ object has no attribute ‘cell’

reason:

The problem should be that the workbook cannot be written at the same time when it is created, so you can create and save the workbook first, and then open it, and the data can be written.

RuntimeError: No HIP GPUs are available [How to Solve]

Error reason:

The code uses GPU accelerated torch, but I downloaded the C + + version of torch. Use PIP list to find packages as follows:


Solution:

Uninstall torch and torchvision, and then use command pip install torch==1.7.0+cu110 torchvision==0.8.0+cu110 torchaudio==0.7.0 -f https://download.pytorch.org/whl/torch_stable.html to install it.

Python parsing JSON Error: NameError: name ‘false’ is not defined

Python parses a JSON string and directly calls JSON.Loads error:

NameError: name 'false' is not defined

Solution:
use Python’s raw strings, that is, add R'''before the JSON string, and then add '' '. For example:

>>> import json
>>> json_string = r'''{"created_at":"Thu Jul 10 20:02:00 +0000 2014","id":487325888950710272,"id_str":"487325888950710272","text":"\u5f81\u9678\u300c\u5de6\u8155\u306e\u7fa9\u624b\u306f\u30db\u30ed\u3060\u300d","source":"\u003ca href=\"http:\/\/twittbot.net\/\" rel=\"nofollow\"\u003etwittbot.net\u003c\/a\u003e","truncated":false,"in_reply_to_status_id":null,"in_reply_to_status_id_str":null,"in_reply_to_user_id":null,"in_reply_to_user_id_str":null,"in_reply_to_screen_name":null,"user":{"id":1429838018,"id_str":"1429838018","name":"\u3053\u3093\u306a\uff30\uff30\u306f\u5acc\u3060\u3002","screen_name":"iyada_pp","location":"\u516c\u5b89\u5c40\u306e\u3069\u3053\u304b\u3002","url":null,"description":"\u3010\u3053\u3093\u306aPSYCHO-PASS\u306f\u5acc\u3060\u306a\u3011\u3068\u3044\u3046\u304f\u3060\u3089\u306a\u3044\u5984\u60f3bot\u3067\u3059\u3002\u30ad\u30e3\u30e9\u5d29\u58ca\u304c\u6fc0\u3057\u3044\u306e\u3067\u3054\u6ce8\u610f\u304f\u3060\u3055\u3044\u3002","protected":false,"followers_count":99,"friends_count":98,"listed_count":5,"created_at":"Wed May 15 07:52:33 +0000 2013","favourites_count":0,"utc_offset":null,"time_zone":null,"geo_enabled":false,"verified":false,"statuses_count":12584,"lang":"ja","contributors_enabled":false,"is_translator":false,"is_translation_enabled":false,"profile_background_color":"C0DEED","profile_background_image_url":"http:\/\/abs.twimg.com\/images\/themes\/theme1\/bg.png","profile_background_image_url_https":"https:\/\/abs.twimg.com\/images\/themes\/theme1\/bg.png","profile_background_tile":false,"profile_image_url":"http:\/\/pbs.twimg.com\/profile_images\/3661872276\/ab7201283dac5dc1789bb6dfa9b6abe4_normal.jpeg","profile_image_url_https":"https:\/\/pbs.twimg.com\/profile_images\/3661872276\/ab7201283dac5dc1789bb6dfa9b6abe4_normal.jpeg","profile_link_color":"0084B4","profile_sidebar_border_color":"C0DEED","profile_sidebar_fill_color":"DDEEF6","profile_text_color":"333333","profile_use_background_image":true,"default_profile":true,"default_profile_image":false,"following":null,"follow_request_sent":null,"notifications":null},"geo":null,"coordinates":null,"place":null,"contributors":null,"retweet_count":0,"favorite_count":0,"entities":{"hashtags":[],"symbols":[],"urls":[],"user_mentions":[]},"favorited":false,"retweeted":false,"filter_level":"medium","lang":"ja"}'''
>>> json.loads(json_string)