Category Archives: How to Fix

What is the schema in the database?

reference resources: http://database.guide/what-is-a-database-schema/

In database, schema (pronounced “skee MUH” or “skee MAH”, called schema in Chinese) is the organization and structure of database. Both schema and schemata can be used as plural forms. Schema objects include table, column, data type, view, stored procedures, relationships, primary key, foreign key, etc. Database schema can be represented by a visual graph, which shows database objects and their relationships


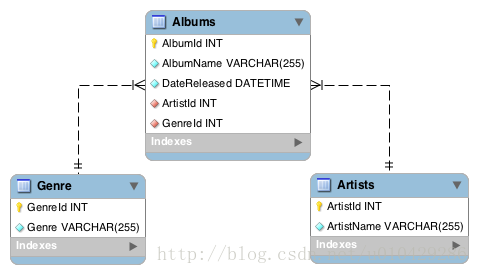
The above is a simple example of a schema diagram, showing three tables and their data types, the relationship between tables, and primary and foreign keys. The following is a more complex example of a database schema.


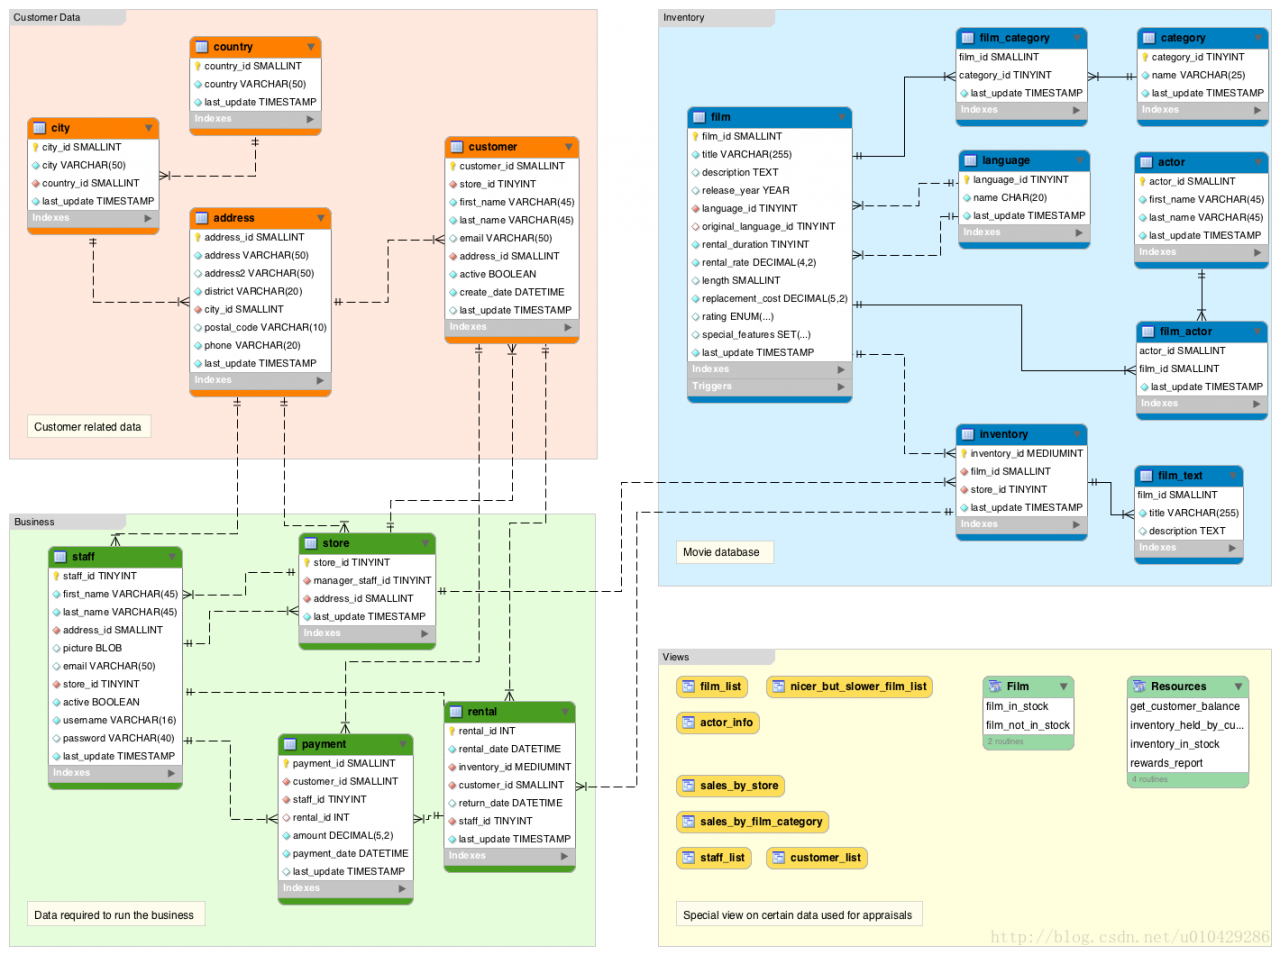
In this case, the pattern diagram is divided into four parts

(1) Customer data: data related to customers, such as name, address, etc

(2) Business: data needed by the business, such as employees, store location, payment details, etc

(3) Inventory: details of all products. Here, the product is a movie, so it contains movie title, category, actor and other data.

(4) Views: special views on the data used for evaluation, so we can further create a database through these schema diagrams. In fact, MySQL workbench allows us to generate a create database directly from the diagram Table script, and then we can directly use this script to create a database, and also directly convert a database into a relational chart.

Are schema and database the same?

When it comes to database schema, there are many doubts. The problem often arises whether there is a difference between schema and database, and if so, where is the difference.

It depends on the database vendor

Part of the confusion about schema is that database systems tend to handle schema in their own way

(1) MySQL documents point out that in physics, schema and database are synonymous, so schema and database are the same thing.

(2) However, Oracle documents point out that some objects can be stored in the database, but not in the schema. Therefore, schema and database are not the same thing.

(3) According to this SQL Server technical article, schema is an independent entity within SQL server. So, they are not the same thing.

Therefore, depending on the RDBMS you are using, the schema and database may not be the same.

How to define schema in SQL standard?

In ISO / IEC 9075-1 SQL standard, schema is defined as a persistent, named collection of descriptors. If you are confused about the definition of schema before, I hope it will be better, at least not worse after reading my article.

In a broad sense

Another reason for the confusion may be that the term schema has such a wide range of meanings, because it has different meanings in different environments. The word schema comes from the Greek SKH ē Ma, which means form, figure, shape or plan. In psychology, schema is used to describe the organized thinking or behavior patterns of organizational information categories and their relationships. Before we design a database, we also need to look at the types of information in the data and the relationship between them. Before we start to use the physical schema in DBMS, we need to create a conceptual schema. When discussing patterns in software development, we can discuss conceptual patterns, physical patterns, internal patterns, external patterns, logical patterns, etc., each of which has its own specific meaning.

Schema definition of DBMS

Here are the schema definitions of three leading relational database systems:

MySQL

Conceptually, a schema is a set of interrelated database objects, such as tables, table columns, data types of the columns, indexes, foreign keys, and so on. These objects are connected through SQL syntax, because the columns make up the tables, the foreign keys refer to tables and columns, and so on. Ideally, they are also connected logically, working together as part of a unified application or flexible framework. For example, theINFORMATION_ SCHEMA and performance_ schema databases use “schema” in their names to emphasize the close relationships between the tables and columns they contain.

In MySQL, physically, aschema is synonymous with adatabase. You can substitute the keywordSCHEMA instead ofDATABASE in MySQL SQL syntax, for example using CREATE SCHEMA instead of CREATE DATABASE.

Some other database products draw a distinction. For example, in the Oracle Database product, aschema represents only a part of a database: the tables and other objects owned by a single user.

MySQL official documents point out that conceptually, a schema is a set of interrelated database objects, such as tables, table columns, column data types, indexes, foreign keys, and so on. But from the physical level, schema and database are synonymous. You can use the keyword schema instead of database in the SQL syntax of MySQL, for example, create schema instead of create database .

Reference: MySQL glossary, MySQL 5.7 reference manual. Mysql, retrieved 6 June 2016.

SQL Server

The names of tables, fields, data types, and primary and foreign keys of a database.

SQL Server official documents point out that the schema contains the database table, field, data type and the name of primary key and foreign key. Reference: SQL Server glossary. SQL Server 2016 technical documentation. Microsoft developer network. Retrieved 6 June 2016

Oracle Database

The schema system in Oracle is very different from other database systems. The schema of Oracle is closely related to database users.

A schema is a collection of logical structures of data, or schema objects. A schema is owned by a database user and has the same name as that user. Each user owns a single schema.

Oracle official documents point out that schema is a collection of logical structures of data or schema objects, which is owned by database users and has the same name as the user, that is to say, each user has an independent schema.

Reference: Oracle database objects. Oracle database online documentation 12C release 1 (12.1). Oracle help center. Retrieved 6 June 2016

If you want to know more about schema, you can refer to this article schema definitions by DBMS

Create schema

Although the above three DBMS are different in defining schema, they all support create schema statements.

MySQL

In mysql, create schema creates a database because create schema is synonymous with create database . In other words, you can use create schema or create database to create a database.

Oracle Database

In Oracle, create schema statement does not actually create a schema, because a schema has been created for database users when creating users, that is to say, create user creates a schema in Oracle, create user creates a schema Schema statements allow you to associate schema with tables and views, and authorize them, so that you don’t have to issue multiple SQL statements in multiple transactions.

SQL Server

In SQL server, create schema creates a schema by name. Unlike mysql, the create schema statement creates a schema that is defined separately to the database. Different from Oracle, the create schema statement actually creates a schema (as mentioned earlier, this statement does not create a schema in Oracle). In SQL server, once the schema is created, users and objects can be added to the schema.

summary

The word schema can be used in many different environments. When creating a schema in a specific DBMS, you need to use the DBMS specific definition mode. When you switch to a new DBMS, you must check how the system defines the schema.

Python — using Matplotlib to draw histogram

Python — using Matplotlib to draw histogram

1. Basic histogram


First, install Matplotlib( http://matplotlib.org/api/pyplot_ api.html#matplotlib . pyplot.plot )You can use the PIP command to install it directly

# -*- coding: utf-8 -*-
import matplotlib.pyplot as plt

num_list = [1.5,0.6,7.8,6]
plt.bar(range(len(num_list)), num_list)
plt.show()

2. Set color


# -*- coding: utf-8 -*-
import matplotlib.pyplot as plt

num_list = [1.5,0.6,7.8,6]
plt.bar(range(len(num_list)), num_list,fc='r')
plt.show()

# -*- coding: utf-8 -*-
import matplotlib.pyplot as plt

num_list = [1.5,0.6,7.8,6]
plt.bar(range(len(num_list)), num_list,color='rgb')
plt.show()

3. Set label

# -*- coding: utf-8 -*-
import matplotlib.pyplot as plt

name_list = ['Monday','Tuesday','Friday','Sunday']
num_list = [1.5,0.6,7.8,6]
plt.bar(range(len(num_list)), num_list,color='rgb',tick_label=name_list)
plt.show()

4. Stacked bar chart

# -*- coding: utf-8 -*-
import matplotlib.pyplot as plt

name_list = ['Monday','Tuesday','Friday','Sunday']
num_list = [1.5,0.6,7.8,6]
num_list1 = [1,2,3,1]
plt.bar(range(len(num_list)), num_list, label='boy',fc = 'y')
plt.bar(range(len(num_list)), num_list1, bottom=num_list, label='girl',tick_label = name_list,fc = 'r')
plt.legend()
plt.show()

5. Side by side bar chart

# -*- coding: utf-8 -*-
import matplotlib.pyplot as plt

name_list = ['Monday','Tuesday','Friday','Sunday']
num_list = [1.5,0.6,7.8,6]
num_list1 = [1,2,3,1]
x =list(range(len(num_list)))
total_width, n = 0.8, 2
width = total_width / n

plt.bar(x, num_list, width=width, label='boy',fc = 'y')
for i in range(len(x)):
    x[i] = x[i] + width
plt.bar(x, num_list1, width=width, label='girl',tick_label = name_list,fc = 'r')
plt.legend()
plt.show()

6. Bar chart

# -*- coding: utf-8 -*-
import matplotlib.pyplot as plt

name_list = ['Monday','Tuesday','Friday','Sunday']
num_list = [1.5,0.6,7.8,6]
plt.barh(range(len(num_list)), num_list,tick_label = name_list)
plt.show()

AttributeError:module“seaborn” has no attribute “lineplot”

When drawing with Seaborn, the following error occurs:

AttributeError: module 'seaborn' has no attribute 'lineplot'

Reason:
the version of Seaborn is a little old. I checked it. The version data of Seaborn is version 0.8.1, and it is lineplot after version 0.9, so I just need to update Seaborn.

pip install -U seaborn

Address of campus mailbox POP3 of Nankai University

text

This semester as a teaching assistant, the mailbox received homework, hundreds of e-mail, manual download attachment is too tired, it is suitable for Python to write an automatic download attachment program. The POP3 address of the mailbox is required for Python to download email attachments. After some trying and searching, we finally found the POP3 address of Nankai campus mailbox: “POP3 mail.nankai.edu .cn”。 Happy to write code to download email attachment.

Python download attachment code

The code I use refers to this blog https://www.cnblogs.com/chouxianyu/p/11270101.html

Detailed explanation of yield in Python — the simplest and clearest explanation

What I make complaints about is what closely reasoned and well argued. First, I want to talk about the process of yield. I found that no one could simply let me know. When I was talking about Baidu, it was all the same, what parameters and what was passed. It was also the simplest and the easiest way to read the TM tutorial. I would like to ask if I have not considered the feelings of the readers.

Next is the topic

First of all, if you don’t have a preliminary understanding of yield, you can regard yield as “return”. This is intuitive. First of all, it is a return. What does the common return mean? It means to return a value in the program. After returning, the program will no longer run down. See it as a return, and then see it as a part of the generator (the function with yield is the real iterator). Well, if you don’t understand this, first consider yield as a return, and then look at the following program directly, you will understand all the meaning of yield:

def foo():
    print("starting...")
    while True:
        res = yield 4
        print("res:",res)
g = foo()
print(next(g))
print("*"*20)
print(next(g))

Just a few lines of code will let you understand what yield is

starting...
4
********************
res: None
4

I directly explain the code running order, which is equivalent to single step debugging of code

1. After the program starts to execute, because there is yield keyword in foo function, foo function will not really execute, but get a generator g (equivalent to an object) first

2. Until the next method is called, the foo function is formally executed. First, the print method in the foo function is executed, and then the while loop is entered

3. When the program encounters the yield keyword, think of yield as return. After a return of 4, the program stops and does not execute the assignment to res operation. At this time, the next (g) statement is executed, so the first two lines of output (the first is the result of print above while, and the second is the result of return) are the result of print (next (g)),

4. The program executes print (“*” * 20) and outputs 20*

5. Start to execute the following print (next (g)), This time is similar to the one above, but the difference is that this time starts from the place where the next program just stopped, that is, the assignment operation of res is to be executed. At this time, it should be noted that there is no value on the right side of the assignment operation (because the return just went out, and no parameter was passed to the left side of the assignment operation), so this time Res is assigned to none, so the next output is res:None ,

6. The program will continue to run in while, and it will encounter yield again. At this time, it will return 4, and then the program will stop. The output 4 of the print function is the return 4


Here you may understand the relationship and difference between yield and return. The function with yield is a generator, not a function. One function of this generator is the next function. Next is equivalent to the number generated in the “next step”. The place where the next starts this time is the place where the next stops last time. Therefore, when calling next, the generator It doesn’t start from the start of foo function. It just starts from the place where the last step stopped. After yield is met, return the number to be generated. This step ends.

****************************************************************************************************************************************

def foo():
    print("starting...")
    while True:
        res = yield 4
        print("res:",res)
g = foo()
print(next(g))
print("*"*20)
print(g.send(7))

Take another example of the send function of this generator. This example replaces the last line of the above example. The output result is as follows:

starting...
4
********************
res: 7
4

Let’s talk about the concept of the send function: at this time, you should pay attention to the purple word above, and why the value of res above is none, which becomes 7. Why? This is because send sends a parameter to res, because it is mentioned above that when return, 4 is not assigned to res, so you have to continue the assignment next time , we have to assign it to none. If we use send, when we start execution, we first assign 7 to res in the last execution (after return 4), and then perform the function of next. When we meet the next yield, the result of return is finished.


5. The program executes g. send (7), the program will continue to run down from the yield keyword line, and send will assign the value of 7 to the res variable

6. Because the send method contains the next () method, the program will continue to run down, execute the print method, and then enter the while loop again

7. When the program encounters the yield keyword again, yield will return the following value, and the program will pause again until the next method or send method is called again.


That’s the end. Let’s talk about why we use this generator because if we use list, it will take up more space, such as 0,1,2,3,4,5,6,… 1000

You might be like this:

for n in range(1000):
    a=n

At this time, range (1000) generates a list containing 1000 numbers by default, so it takes up a lot of memory.

At this time, you can use the yield combination generator just now to realize it, or you can use xrange (1000) to realize it

Yield Combination:

def foo(num):
    print("starting...")
    while num<10:
        num=num+1
        yield num
for n in foo(0):
    print(n)

Output:

starting...
1
2
3
4
5
6
7
8
9
10

* xrange(1000):

for n in xrange(1000):
    a=n

It should be noted that there is no xrange () in python3. In python3, range () is xrange (). You can check the type of range () in python3. It is a & lt; class’ range ‘& gt; instead of a list. After all, it needs to be optimized.  

Thank you

If you feel helpful, your appreciation is my greatest support!

Several common methods of inserting pictures into latex documents

zz from: http://hepg.sdu.edu.cn/Service/tips/latex/latexfig.html#top & http://liqunsun.spaces.live.com/Blog/cns!285A08B51269F219!109.entry

Generally, latex only supports inserting EPS (encapsulated postscript) format graphics files directly, so we should try to get EPS format files before inserting pictures into latex documents.

all kinds of application software under UNIX can output the results in PS format, Most software can also output EPS format. If the software can only output PS format but not EPS format results, it can be converted to EPS format by ps2epsi command. Please refer to man ps2epsi’s instructions. If the image file format is bitmap graphics file, it can be converted to PS or EPS format file by display and convert tools of image magic package. See man page and man page for details

instructions

the output of windows software becomes PS / EPS file: please refer to the

“How to convert the output of software in Windows system into PS and EPS files”

Description in the column


Inserting pictures into latex documents is realized by using some latex graphics processing macro commands. Many macro commands support inserting EPS format graphics files into latex documents

(1) Using the macro command of includegraphics (graphicx package)

First of all, you need to add the following in the file description of latex document:

/usepackage{graphicx}

Then, it is quoted in the place where the image needs to be inserted:
/ includegraphics [height = height] {image file name} or / includegraphics [width = width] {image file name}
where “height” and “width” refer to the height and width of the image to be printed, and the unit must be given, which can be centimeter (CM) or inch (in), The image file name in the above command refers to the file name of the image file to be inserted. The image must be in EPS format

When inserting a picture with the macro command includegraphics of the graphicx package, you can also rotate the picture by:
/ includegraphics [height = height] [angle = rotation angle] {picture file name}

The inserted graphics are usually in EPS, PDF, JPG, PNG and other formats. Suppose the name is fig, and put it in the same directory of your tex document.
1. First add a sentence / usepackage {graphicx}
in the introduction area. 2. If you want to insert an inline graphic, you can directly use
/ includegraphics [width = 5in] {fig},
without adding a suffix.
This width is my most commonly used option, which can also be changed to other options.
3. If you want to insert floating graphics, use
/ begin {figure} [htbp]
/ centering / includgraphics [width = 3.5in] {fig}
/ caption {something} / label{ fig:1 }
/ end {figure}
4. For EPS graphics, the compilation process is latex, dvips, ps2pdf.
for PDF JPG PNG graphics, the compilation process is pdflatex

Use the include graphics macro command (graphics package) to:

It is troublesome to insert pictures with graphics package

(2) Using psfig macro command

First of all, you need to add the following in the file description of latex document:

/usepackage{psfig}

Then, it is quoted in the place where the picture needs to be inserted:
/ psfig {figure = picture file name, height = height} or / psfig {figure = picture file name, width = width}
where “height” and “width” refer to the height and width of the picture you want to print, and the unit bit must be given, which can be centimeter (CM) or inch (in), The image file name in the above command refers to the file name of the image file to be inserted. The image must be in EPS format

(3) use the epsfig macro command

The usage of epsfig macro command is exactly the same as that of psfig. The specific method is as follows:
first, add the following in the file description of latex document:

/usepackage{epsfig}

Then reference where you want to insert the image:

/ epsfig {figure = picture file name, height = height} or / epsfig {figure = picture file name, width = width}

The “height” and “width” refer to the height and width of the picture you want to print. The unit must be given, which can be centimeter (CM) or inch (in). The height and width can also be in the above format

The image file name in the above command refers to the file name of the image file to be inserted, and the image must be in EPS format


(4) Using EpsF macro command

The usage of EpsF macro command is as follows: first, add the following in the file description of latex document:

/usepackage{epsf}

Then, you can refer to:
/ epsfxsize = width / epsffile {image file name} or / epsfysize = height / epsffile {image file name} where you want to insert the image

The “height” and “width” refer to the height and width of the image to be printed. The unit must be given, which can be centimeter (CM) or inch (in). The height and width can also be given in the above format, so that the length width ratio of the original image can be changed. The image file name in the above command refers to the file name of the image file to be inserted, and the image must be in EPS format


(5) Latex? Picture control command, position control

Latex controls the position of the image by adding an exclamation point to ignore the “aesthetic” standard.
/ begin {figure} [! HTB]
/ usepackage {float}
/ begin {figure} [H]
insert it into the corresponding position of your code.

1, insert the side-by-side subgraph
/ usepackage {subfigure}

/ begin {figure} [H]
/ centering
/ subfigure [subfigurecaption] {
/ label{ Fig.sub .1}
/includegraphics[width=0.4/textwidth]{ figurename.eps }}
/subfigure[SubfigureCaption]{
/label{ Fig.sub .2}
/includegraphics[width=0.4/textwidth]{ figurename.eps }}
/caption{MainfigureCaption}
/label{ Fig.lable }
/ end {figure}

2, control the image position
if you don’t like latex to automatically arrange the image position, you can use the float package, and then
use / begin {figure} [H].
/ usepackage {float}
1, insert JPG image
in the command line environment, use the command:
ebb figure.jpg
Generating bounding box file figure.bb .
Use the following command:
/ includegraphics [width = 0.8/textwidth]{ figure.jpg }
PDF texify can be directly compiled into PDF file.
2, insert BMP image
there is no way to insert BMP image directly. The current method is to use
gimp to convert BMP into JPG, and then insert it according to the above method. When converting, do not use windows built-in painter, as the image quality is lost too much. With gimp or
fastone image viewer, the JPG quality is the highest, and the image quality is better.
3, insert JPG and EPS images at the same time
the insert command remains unchanged. When compiling, it uses latex and dvi2pdf, and the
images in both formats can be displayed.
Insert EPS picture
use / includegraphics [options] {file} command to insert EPS picture. The following is the simplest example:
/ documentclass {article}
/ usepackage {graphicx}% using the graphicx package
/ begin {document}
/ includegraphics{ file.eps }% insert the picture, insert it according to the original size of the picture
/ end {document}
note:
(1) EPS file and Tex file are placed in the same folder, which can be called only by the file name, without writing the path.
(2) Pdflatex cannot be used at compile time, an error will occur. Even if there are no mistakes, you can’t see the diagram. We should use latex compilation to generate DVI, and then dvi2ps, ps2pdf can see the figure.
Use [options] to specify the image size:
/ includegraphics [width = 3in]{ file.eps }
set the image width to 3 inches, and the image height will be automatically scaled.
/includegraphics[width=/testwidth]{ file.eps }
set the image width to the text width.
/includegraphics[width=0.8/textwidth]{ file.eps }
set the image width to 0.8 times the text width
/ includegraphics [width = / testwidth-2.0in]{ file.eps }
set the image width to be 2 inches less than the text width.
Use [options] to specify the image rotation angle:
/ includegraphics [angle = 270]{ file.eps }
rotate the image 270 degrees.
The two options are used at the same time, separated by commas:
/ includegraphics [width = / testwidth, angle = 270]{ file.eps }


A few useful articles on graph problems in latex

Graphics and Colour with LaTeX 

Online guide to illustration and color use in latex

Figure’ing and picture’ing latex (PS format)

The method of inserting PS graph and xfig graph into latex

Using imported graphics in latex 2e (PS format)

The illustration in latex is discussed in detail, including basic concepts, file formats and their mutual conversion, related software, etc. in addition, how to replace the characters in PS format pictures with latex format characters is also discussed, so as to solve the problem that some application software can not use special characters such as Greek alphabet and complex mathematical formula expressions

Latex maths and graphics (PS format)

It is mainly about the method of inserting pictures and formulas into latex.

this paper introduces the method of inserting pictures and formulas into latex

About Visio to EPS

Many people are used to drawing with Visio (including me), but Visio can’t export EPS format, so they have to rely on third-party software. Save it as *. EMF format through Visio, and then open it with OpenOffice draw to export it to EPS format. When exporting, you need to select the open image, so that after exporting EPS, only the content of *. EMF image will be included, and there will be no large blank. But the EPS image exported by this method will be out of shape, for example, the straight line will often be intermittent, and the “computer” shape I added in Visio will also have inexplicable shadows. Or maybe I didn’t set it up.

There is another better solution, the EPS file exported is perfect. In other words, the Visio graphics are printed into PDF by acrobat printer, and then cut by gsview (gsview4.8). The specific process is as follows:

1 edit the image file and save it as PDF file

Install acrobat, print the edited picture as PDF file under Visio and word


2 to EPS file

Open PDF file in acobat and select Save as EPS file


3. Reduce EPS files

Open EPS file with gsview, select File — & gt; PS to EPS, select auto cut, and save it as another *. EPS file

Solving equations and equations with MATLAB

1. Solve function

① Numerical solution of single equation

syms x;

x0 = double(solve(x +2 – exp(x),x));

Find the solution of X + 2 = exp (x), and the result is shown in double

In use, you can also write x + 2 = = exp (x), note that ‘= =’

In addition, if there are multiple solutions, the function returns only one solution

② Solving the equation with signed variables

syms x a b c;

x0 = solve(a*x^2+b*x+c,x);

Two solutions can be obtained

③ Solving equations

syms x y z;

e1 = 2*x – y +z;

e2 = x + y – 6;

e3 = z^2 +2*y;

[x0,y0,z0] = solve(e1,e2,e3,x,y,z);

double([x0,y0,z0])

Can return multiple solutions, note that can not directly solve double conversion

2. Vpasolve function

Only one solution can be returned to solve the equation in a certain range

syms x;

double(vpasolve(x +2 – exp(x),x,[-2,2]))

The solution near a point can also be obtained

double(vpasolve(x +2 – exp(x),x,1))

The premise is that this’ nearby point ‘cannot deviate too much from the solution

To find out all the solutions, we can first draw a graph and find out the approximate interval or adjacent points of each solution