Tag Archives: elasticsearch

elasticsearch NoClassDefFoundError error creating RestHighLevelClient bean

NoClassDefFoundError is usually a configuration error – which means that the code you use refers to a class, but the class itself is not in the classpath. In this case, this may also be a dependency management error in the relevant elasticsearch POMS itself, because it should contain the required classes

        <dependency>
            <groupId>org.elasticsearch.client</groupId>
            <artifactId>elasticsearch-rest-high-level-client</artifactId>
            <version>7.6.2</version>
        </dependency>
        <dependency>
            <groupId>org.elasticsearch.client</groupId>
            <artifactId>elasticsearch-rest-client</artifactId>
            <version>7.6.2</version>
        </dependency>
        <dependency>
            <groupId>org.elasticsearch</groupId>
            <artifactId>elasticsearch</artifactId>
            <version>7.6.2</version>
        </dependency>

Complete dependency, OK
(pay attention to switching to your own version)
maybe your mood is broken at the moment. Don’t worry. I believe it will bring you good luck _

Elasticsearch Startup Error: unable to install syscall filter: java.lang.UnsupportedOperationException: seccomp

Error Message:

[2021-09-12T10:40:53,855][WARN ][o.e.b.JNANatives         ] [DESKTOP-BPG73KH] unable to install syscall filter:
java.lang.UnsupportedOperationException: seccomp unavailable: CONFIG_SECCOMP not compiled into kernel, CONFIG_SECCOMP and CONFIG_SECCOMP_FILTER are needed
        at org.elasticsearch.bootstrap.SystemCallFilter.linuxImpl(SystemCallFilter.java:342) ~[elasticsearch-7.7.0.jar:7.7.0]
        at org.elasticsearch.bootstrap.SystemCallFilter.init(SystemCallFilter.java:617) ~[elasticsearch-7.7.0.jar:7.7.0]        at org.elasticsearch.bootstrap.JNANatives.tryInstallSystemCallFilter(JNANatives.java:260) [elasticsearch-7.7.0.jar:7.7.0]
        at org.elasticsearch.bootstrap.Natives.tryInstallSystemCallFilter(Natives.java:113) [elasticsearch-7.7.0.jar:7.7.0]
        at org.elasticsearch.bootstrap.Bootstrap.initializeNatives(Bootstrap.java:116) [elasticsearch-7.7.0.jar:7.7.0]
        at org.elasticsearch.bootstrap.Bootstrap.setup(Bootstrap.java:178) [elasticsearch-7.7.0.jar:7.7.0]
        at org.elasticsearch.bootstrap.Bootstrap.init(Bootstrap.java:393) [elasticsearch-7.7.0.jar:7.7.0]
        at org.elasticsearch.bootstrap.Elasticsearch.init(Elasticsearch.java:170) [elasticsearch-7.7.0.jar:7.7.0]
        at org.elasticsearch.bootstrap.Elasticsearch.execute(Elasticsearch.java:161) [elasticsearch-7.7.0.jar:7.7.0]
        at org.elasticsearch.cli.EnvironmentAwareCommand.execute(EnvironmentAwareCommand.java:86) [elasticsearch-7.7.0.jar:7.7.0]
        at org.elasticsearch.cli.Command.mainWithoutErrorHandling(Command.java:127) [elasticsearch-cli-7.7.0.jar:7.7.0]
        at org.elasticsearch.cli.Command.main(Command.java:90) [elasticsearch-cli-7.7.0.jar:7.7.0]
        at org.elasticsearch.bootstrap.Elasticsearch.main(Elasticsearch.java:126) [elasticsearch-7.7.0.jar:7.7.0]
        at org.elasticsearch.bootstrap.Elasticsearch.main(Elasticsearch.java:92) [elasticsearch-7.7.0.jar:7.7.0]

Solution:

Problem reason: because centos6 does not support seccomp, es5.2.1 defaults to bootstrap.system_call_filter is true for detection, so the detection fails. After the failure, the ES cannot be started directly. See: https://github.com/elastic/elasticsearch/issues/22899

Solution: configure bootstrap.system in elasticsearch. YML _ call_ If the filter is false, note that it should be under memory:

bootstrap.memory_lock: false
bootstrap.system_call_filter: false

An error occurs when es logstash is installed and running

Error message:

Expected one of [ \\t\\r\\n], \”#\”, \”input\”, \”filter\”, \”output\” at line 1, column 1 (byte 1)

Logstash run command:./logstash – f config MySQL/

SQL configuration file:/home/ES/logstash/bin/config MySQL/mysql-1.conf

SQL statement file:/home/ES/logstash/bin/config MySQL/tk.sql

JDBC configuration uses the configuration: statement_ filepath => “/home/es/logstash/bin/config-mysql/tk.sql”

terms of settlement:

        Put tk.sql in another file, for example:/home/ES/logstash/config/tk.sql

        As long as it is not in the same directory as the SQL configuration file, it is OK

[Solved] ELK Log System Error: “statusCode“:429,“error“:“Too Many Requests“,“message“ Data too large

Elk log system error

The error information is as follows:

{"statusCode":429,"error":"Too Many Requests","message":"[circuit_breaking_exception] [parent] Data too large, data for [indices:data/write/bulk[s]] would be [2087165840/1.9gb], which is larger than the limit of [2040109465/1.8gb], real usage: [2087165392/1.9gb], new bytes reserved: [448/448b], usages [request=0/0b, fielddata=182738/178.4kb, in_flight_requests=448/448b, model_inference=0/0b, accounting=89449992/85.3mb], with { bytes_wanted=2087165840 & bytes_limit=2040109465 & durability=\"PERMANENT\" }"}

Du Niang said something, which probably means that the memory given to ES is not enough. However, there is no timely recovery of memory
too much data leads to insufficient memory. You can set the memory limit of fielddata, which is 60% by default

Solution 1: modify the configuration file

Modify the ES configuration file and add the following configuration
[ root@sjyt -node-1 ~]# vim /etc/elasticsearch/elasticsearch.yml

# Avoid OOM, which can have a significant impact on the cluster, by combining request and fielddata breakers to ensure that the combination of the two does not use more than 70% of the heap memory.
indices.breaker.total.limit: 80%

# With this setting, the longest unused (LRU) fielddata will be reclaimed to make room for new data   
indices.fielddata.cache.size: 10%

# fielddata breaker defaults to set the heap as the upper limit of fielddata size.
indices.breaker.fielddata.limit: 60%

The #request breaker estimates the size of structures that need to complete other request parts, such as creating an aggregation bucket, with a default limit of 40% of the heap memory.
indices.breaker.request.limit: 40%

#Longest unused (LRU) fielddata will be reclaimed to make room for new data Must add configuration
indices.breaker.total.use_real_memory: false

After removing the note:

indices.breaker.total.limit: 80%  
indices.fielddata.cache.size: 10%
indices.breaker.fielddata.limit: 60%
indices.breaker.request.limit: 40%
indices.breaker.total.use_real_memory: false

Solution 2: dynamic setting

Reference connection: https://blog.csdn.net/sdlyjzh/article/details/48035723

PUT /_cluster/settings
{
"persistent" : {
"indices.breaker.fielddata.limit" : "40%"
}
}

When the size of the fielddata circuit breaker exceeds the set value, the data too large mentioned at the beginning will appear.

ElasticSearch Create Index Error: mapper_parsing_exception Root mapping definition has unsupported parameters

elasticsearch version number: 5.6.14. This error has something to do with the ES version. You’d better explain the version number first so that some readers will not be invalid after operating according to my method

error mapping statement 1:

{
    "test_0904": {
        "mappings": {
            "user": {
                "properties": {
                    "birthday": {
                        "type": "date",
                        "store": true
                    },
                    "hobby": {
                        "type": "text",
                        "store": true
                    },
                    "id": {
                        "type": "long",
                        "store": true
                    },
                    "name": {
                        "type": "text",
                        "store": true
                    }
                }
            }
        }
    }
}

error mapping statement 2:

{
    "mappings": {
        "user": {
            "properties": {
                "birthday": {
                    "type": "date",
                    "store": true
                },
                "hobby": {
                    "type": "text",
                    "store": true
                },
                "id": {
                    "type": "long",
                    "store": true
                },
                "name": {
                    "type": "text",
                    "store": true
                }
            }
        }
    }
}

modified mapping statement:

{
    "properties": {
        "birthday": {
            "type": "date",
            "store": true
        },
        "hobby": {
            "type": "text",
            "store": true
        },
        "id": {
            "type": "long",
            "store": true
        },
        "name": {
            "type": "text",
            "store": true
        }
    }
}

To sum up, there are some differences in the structure of mapping statements supported by various versions of ES. Different versions have different statement writing methods. Some versions of parameters support and some versions do not support.

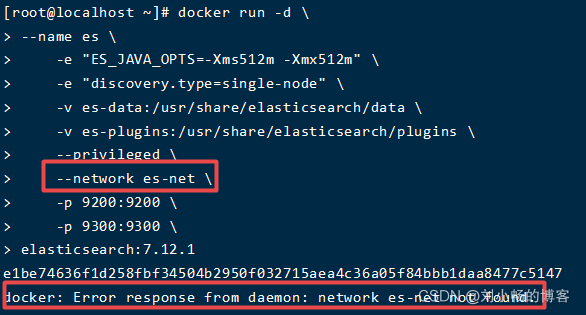
Docker creation container cannot find network card: error response from daemon: network XXXX not found

1. Phenomenon

The ES net network card was not found

  2. Solutions

(1) Create a new custom network type

Docker network create es net (network card name)

(2) disconnect the container from the previous custom network

Docker network disconnect es net es (container name)

(3) establish a connection between the container and a new custom network

Docker network connect es net es (container name)

(4) start the container

docker start es

[Solved] Elasticsearch-7.2.1 startup error: ERROR: [1] bootstrap checks failed

1、elasticsearch-7.2.1 startup error: the default discovery settings are unsuitable for production use; at least one of [discovery.seed_hosts, discovery.seed_providers, cluster.initial_master_nodes] must be configured。

 1 [elsearch@slaver2 elasticsearch-7.2.1]$ ./bin/elasticsearch
 2 future versions of Elasticsearch will require Java 11; your Java version from [/usr/local/soft/jdk1.8.0_281/jre] does not meet this requirement
 3 [2021-03-23T15:13:43,592][INFO ][o.e.e.NodeEnvironment    ] [slaver2] using [1] data paths, mounts [[/ (/dev/mapper/centos-root)]], net usable_space [1.1gb], net total_space [9.9gb], types [xfs]
 4 [2021-03-23T15:13:43,599][INFO ][o.e.e.NodeEnvironment    ] [slaver2] heap size [990.7mb], compressed ordinary object pointers [true]
 5 [2021-03-23T15:13:43,605][INFO ][o.e.n.Node               ] [slaver2] node name [slaver2], node ID [FsI1qieBQ5Kn4MYh001oHQ], cluster name [elasticsearch]
 6 [2021-03-23T15:13:43,607][INFO ][o.e.n.Node               ] [slaver2] version[7.2.1], pid[10143], build[default/tar/fe6cb20/2019-07-24T17:58:29.979462Z], OS[Linux/3.10.0-1160.el7.x86_64/amd64], JVM[Oracle Corporation/Java HotSpot(TM) 64-Bit Server VM/1.8.0_281/25.281-b09]
 7 [2021-03-23T15:13:43,610][INFO ][o.e.n.Node               ] [slaver2] JVM home [/usr/local/soft/jdk1.8.0_281/jre]
 8 [2021-03-23T15:13:43,612][INFO ][o.e.n.Node               ] [slaver2] JVM arguments [-Xms1g, -Xmx1g, -XX:+UseConcMarkSweepGC, -XX:CMSInitiatingOccupancyFraction=75, -XX:+UseCMSInitiatingOccupancyOnly, -Des.networkaddress.cache.ttl=60, -Des.networkaddress.cache.negative.ttl=10, -XX:+AlwaysPreTouch, -Xss1m, -Djava.awt.headless=true, -Dfile.encoding=UTF-8, -Djna.nosys=true, -XX:-OmitStackTraceInFastThrow, -Dio.netty.noUnsafe=true, -Dio.netty.noKeySetOptimization=true, -Dio.netty.recycler.maxCapacityPerThread=0, -Dlog4j.shutdownHookEnabled=false, -Dlog4j2.disable.jmx=true, -Djava.io.tmpdir=/tmp/elasticsearch-6519446121284753262, -XX:+HeapDumpOnOutOfMemoryError, -XX:HeapDumpPath=data, -XX:ErrorFile=logs/hs_err_pid%p.log, -XX:+PrintGCDetails, -XX:+PrintGCDateStamps, -XX:+PrintTenuringDistribution, -XX:+PrintGCApplicationStoppedTime, -Xloggc:logs/gc.log, -XX:+UseGCLogFileRotation, -XX:NumberOfGCLogFiles=32, -XX:GCLogFileSize=64m, -Dio.netty.allocator.type=unpooled, -XX:MaxDirectMemorySize=536870912, -Des.path.home=/usr/local/soft/elasticsearch-7.2.1, -Des.path.conf=/usr/local/soft/elasticsearch-7.2.1/config, -Des.distribution.flavor=default, -Des.distribution.type=tar, -Des.bundled_jdk=true]
 9 [2021-03-23T15:13:49,428][INFO ][o.e.p.PluginsService     ] [slaver2] loaded module [aggs-matrix-stats]
10 [2021-03-23T15:13:49,429][INFO ][o.e.p.PluginsService     ] [slaver2] loaded module [analysis-common]
11 [2021-03-23T15:13:49,431][INFO ][o.e.p.PluginsService     ] [slaver2] loaded module [data-frame]
12 [2021-03-23T15:13:49,433][INFO ][o.e.p.PluginsService     ] [slaver2] loaded module [ingest-common]
13 [2021-03-23T15:13:49,434][INFO ][o.e.p.PluginsService     ] [slaver2] loaded module [ingest-geoip]
14 [2021-03-23T15:13:49,435][INFO ][o.e.p.PluginsService     ] [slaver2] loaded module [ingest-user-agent]
15 [2021-03-23T15:13:49,435][INFO ][o.e.p.PluginsService     ] [slaver2] loaded module [lang-expression]
16 [2021-03-23T15:13:49,436][INFO ][o.e.p.PluginsService     ] [slaver2] loaded module [lang-mustache]
17 [2021-03-23T15:13:49,438][INFO ][o.e.p.PluginsService     ] [slaver2] loaded module [lang-painless]
18 [2021-03-23T15:13:49,439][INFO ][o.e.p.PluginsService     ] [slaver2] loaded module [mapper-extras]
19 [2021-03-23T15:13:49,441][INFO ][o.e.p.PluginsService     ] [slaver2] loaded module [parent-join]
20 [2021-03-23T15:13:49,443][INFO ][o.e.p.PluginsService     ] [slaver2] loaded module [percolator]
21 [2021-03-23T15:13:49,445][INFO ][o.e.p.PluginsService     ] [slaver2] loaded module [rank-eval]
22 [2021-03-23T15:13:49,446][INFO ][o.e.p.PluginsService     ] [slaver2] loaded module [reindex]
23 [2021-03-23T15:13:49,447][INFO ][o.e.p.PluginsService     ] [slaver2] loaded module [repository-url]
24 [2021-03-23T15:13:49,448][INFO ][o.e.p.PluginsService     ] [slaver2] loaded module [transport-netty4]
25 [2021-03-23T15:13:49,448][INFO ][o.e.p.PluginsService     ] [slaver2] loaded module [x-pack-ccr]
26 [2021-03-23T15:13:49,448][INFO ][o.e.p.PluginsService     ] [slaver2] loaded module [x-pack-core]
27 [2021-03-23T15:13:49,449][INFO ][o.e.p.PluginsService     ] [slaver2] loaded module [x-pack-deprecation]
28 [2021-03-23T15:13:49,449][INFO ][o.e.p.PluginsService     ] [slaver2] loaded module [x-pack-graph]
29 [2021-03-23T15:13:49,449][INFO ][o.e.p.PluginsService     ] [slaver2] loaded module [x-pack-ilm]
30 [2021-03-23T15:13:49,450][INFO ][o.e.p.PluginsService     ] [slaver2] loaded module [x-pack-logstash]
31 [2021-03-23T15:13:49,450][INFO ][o.e.p.PluginsService     ] [slaver2] loaded module [x-pack-ml]
32 [2021-03-23T15:13:49,450][INFO ][o.e.p.PluginsService     ] [slaver2] loaded module [x-pack-monitoring]
33 [2021-03-23T15:13:49,451][INFO ][o.e.p.PluginsService     ] [slaver2] loaded module [x-pack-rollup]
34 [2021-03-23T15:13:49,451][INFO ][o.e.p.PluginsService     ] [slaver2] loaded module [x-pack-security]
35 [2021-03-23T15:13:49,452][INFO ][o.e.p.PluginsService     ] [slaver2] loaded module [x-pack-sql]
36 [2021-03-23T15:13:49,456][INFO ][o.e.p.PluginsService     ] [slaver2] loaded module [x-pack-watcher]
37 [2021-03-23T15:13:49,460][INFO ][o.e.p.PluginsService     ] [slaver2] no plugins loaded
38 [2021-03-23T15:13:59,813][INFO ][o.e.x.s.a.s.FileRolesStore] [slaver2] parsed [0] roles from file [/usr/local/soft/elasticsearch-7.2.1/config/roles.yml]
39 [2021-03-23T15:14:01,757][INFO ][o.e.x.m.p.l.CppLogMessageHandler] [slaver2] [controller/10234] [Main.cc@110] controller (64 bit): Version 7.2.1 (Build 4ad685337be7fd) Copyright (c) 2019 Elasticsearch BV
40 [2021-03-23T15:14:03,624][DEBUG][o.e.a.ActionModule       ] [slaver2] Using REST wrapper from plugin org.elasticsearch.xpack.security.Security
41 [2021-03-23T15:14:05,122][INFO ][o.e.d.DiscoveryModule    ] [slaver2] using discovery type [zen] and seed hosts providers [settings]
42 [2021-03-23T15:14:09,123][INFO ][o.e.n.Node               ] [slaver2] initialized
43 [2021-03-23T15:14:09,125][INFO ][o.e.n.Node               ] [slaver2] starting ...
44 [2021-03-23T15:14:09,472][INFO ][o.e.t.TransportService   ] [slaver2] publish_address {192.168.110.135:9300}, bound_addresses {192.168.110.135:9300}
45 [2021-03-23T15:14:09,504][INFO ][o.e.b.BootstrapChecks    ] [slaver2] bound or publishing to a non-loopback address, enforcing bootstrap checks
46 ERROR: [1] bootstrap checks failed
47 [1]: the default discovery settings are unsuitable for production use; at least one of [discovery.seed_hosts, discovery.seed_providers, cluster.initial_master_nodes] must be configured
48 [2021-03-23T15:14:09,550][INFO ][o.e.n.Node               ] [slaver2] stopping ...
49 [2021-03-23T15:14:09,627][INFO ][o.e.n.Node               ] [slaver2] stopped
50 [2021-03-23T15:14:09,629][INFO ][o.e.n.Node               ] [slaver2] closing ...
51 [2021-03-23T15:14:09,681][INFO ][o.e.n.Node               ] [slaver2] closed
52 [2021-03-23T15:14:09,690][INFO ][o.e.x.m.p.NativeController] [slaver2] Native controller process has stopped - no new native processes can be started

Solution:

In the config directory of elasticsearch, modify the elasticsearch.yml configuration file and add the following configuration to the configuration file:

1 ip replace host1, etc., multiple nodes please add more than one ip address, single node can be written by default to
2 # configure the following three, at least one of them #[discovery.seed_hosts, discovery.seed_providers, cluster.initial_master_nodes]
3 #cluster.initial_master_nodes: ["node-1", "node-2"]
4 cluster.initial_master_nodes: ["192.168.110.135"]
circuit_breaking_exception,“reason“:“[parent] Data too large, data for [<http_request>]

Es circuit breaker, the JVM heap memory is not enough to load data for the current query, so it will report data too large, and the request is blown.

1、 Cause of occurrence

There are too many batch import data or too many query data, which is more frequent  

When the cluster status is yellow or red, analyze the reason:

GET _ cluster/allocation/explain

2、 Periodically clean up the cache

The regular memory cleaning can not ensure the availability of the server. However, if the memory is not enough, the ES can increase the availability of the service.

Although the query may be slow, it is much better than directly reporting an error, unable to query and unsuccessful data saving

1. Clean cache method

delete   data acquisition   Indexes   Cache:   POST  / collect_ data*/_ cache/clear

monitor   Field cache: get  /_ stats/fielddata?fields=*

2. Restart cluster node

If the cleanup cache is invalid_ Cache/clear, then restart.

If it occurs frequently    The data too large is abnormal. I think it can be reduced again    indices.fielddata.cache.size   This setting. Let it clean up the cache as soon as possible.

Increase at the same time   The available memory of ES, and the limit size corresponding to the available memory: i.e   indices.breaker..limit

Through monitoring, find the cause of the problem: get  /_ cluster/stats?pretty

3、 Optimize query

1. Increase server memory and ES cluster

When there is too much index data and the server memory is too small, even if the cache is cleaned regularly, the  _ In cache/clear, there is still an exception that triggers the fuse. At this time, we can only consider upgrading the memory and expanding the ES cluster.

2. Avoid using   Index name*

This method is similar to select * from table

For example, I generate an index every year or every month   user_ 2020, and user_ two thousand and nineteen

When querying, I use the index as follows:   user*   This will definitely affect the query performance,

If a complex aggregation statement, es will aggregate all indexes beginning with user, which must occupy a lot of memory.

At this time, you can consider whether it is the query statement usage of ES?Check and optimize

More tuning References:    https://blog.csdn.net/andy_ only/article/details/98172044

3. JVM configuration uses G1 garbage collector

[Solved] Elasticsearch error: cannot downgrade a node from version [7.xx.x] to version [7.xx.x]

Accident scene

First, install elasticsearch 7.13.3 , then uninstall it, and then install elasticsearch 7.13.2 , start to report an error:

java.lang.IllegalStateException: cannot downgrade a node from version [7.13.3] to version [7.13.2]
	at org.elasticsearch.env.NodeMetadata.upgradeToCurrentVersion(NodeMetadata.java:83) ~[elasticsearch-7.13.2.jar:7.13.2]
	at org.elasticsearch.env.NodeEnvironment.loadNodeMetadata(NodeEnvironment.java:423) ~[elasticsearch-7.13.2.jar:7.13.2]
	at org.elasticsearch.env.NodeEnvironment.<init>(NodeEnvironment.java:320) ~[elasticsearch-7.13.2.jar:7.13.2]
	at org.elasticsearch.node.Node.<init>(Node.java:368) ~[elasticsearch-7.13.2.jar:7.13.2]
	at org.elasticsearch.node.Node.<init>(Node.java:278) ~[elasticsearch-7.13.2.jar:7.13.2]
	at org.elasticsearch.bootstrap.Bootstrap$5.<init>(Bootstrap.java:217) ~[elasticsearch-7.13.2.jar:7.13.2]
	at org.elasticsearch.bootstrap.Bootstrap.setup(Bootstrap.java:217) ~[elasticsearch-7.13.2.jar:7.13.2]
	at org.elasticsearch.bootstrap.Bootstrap.init(Bootstrap.java:397) [elasticsearch-7.13.2.jar:7.13.2]
	at org.elasticsearch.bootstrap.Elasticsearch.init(Elasticsearch.java:159) [elasticsearch-7.13.2.jar:7.13.2]
	at org.elasticsearch.bootstrap.Elasticsearch.execute(Elasticsearch.java:150) [elasticsearch-7.13.2.jar:7.13.2]
	at org.elasticsearch.cli.EnvironmentAwareCommand.execute(EnvironmentAwareCommand.java:75) [elasticsearch-7.13.2.jar:7.13.2]
	at org.elasticsearch.cli.Command.mainWithoutErrorHandling(Command.java:116) [elasticsearch-cli-7.13.2.jar:7.13.2]
	at org.elasticsearch.cli.Command.main(Command.java:79) [elasticsearch-cli-7.13.2.jar:7.13.2]
	at org.elasticsearch.bootstrap.Elasticsearch.main(Elasticsearch.java:115) [elasticsearch-7.13.2.jar:7.13.2]
	at org.elasticsearch.bootstrap.Elasticsearch.main(Elasticsearch.java:81) [elasticsearch-7.13.2.jar:7.13.2]

Cause of the accident

The elasticsearch 7.13.3 is not unloaded completely, and some data remains in the /var/lib/elasticsearch path, which needs to be deleted at the same time;


Errors encountered by elasticsearch in creating index and mapping

         According to station B black horse programmer’s es video tutorial operation, because the version used is the latest version, encountered in the video did not appear in the error.

Address:

http://127.0.0.1:9200/blog

  Request body:

{
  "settings": {
    "number_of_shards": 5,
    "number_of_replicas": 1
  },
  "mappings": {
    "hello": {
      "properties": {
		"id": {
			"type": "long",
			"store": true
		},
		"title": {
			"type": "text",
			"store": true,
			"index": true,
			"analyzer":"standard"
		},
		"content": {
			"type": "text",
			"store": true,
			"index": true,
			"analyzer":"standard"
		}
      }
    }
  }
}

Error message:

{
    "error": {
        "root_cause": [
            {
                "type": "mapper_parsing_exception",
                "reason": "Root mapping definition has unsupported parameters:  [hello : {properties={id={store=true, type=long}, title={analyzer=standard, index=true, store=true, type=text}, content={analyzer=standard, index=true, store=true, type=text}}}]"
            }
        ],
        "type": "mapper_parsing_exception",
        "reason": "Failed to parse mapping [_doc]: Root mapping definition has unsupported parameters:  [hello : {properties={id={store=true, type=long}, title={analyzer=standard, index=true, store=true, type=text}, content={analyzer=standard, index=true, store=true, type=text}}}]",
        "caused_by": {
            "type": "mapper_parsing_exception",
            "reason": "Root mapping definition has unsupported parameters:  [hello : {properties={id={store=true, type=long}, title={analyzer=standard, index=true, store=true, type=text}, content={analyzer=standard, index=true, store=true, type=text}}}]"
        }
    },
    "status": 400
}

Solution: after the request address, add?include_ type_ name=true

http://127.0.0.1:9200/blog?include_type_name=true

result:  

{
    "acknowledged": true,
    "shards_acknowledged": true,
    "index": "blog"
}

[Solved] Es delete all the data in the index without deleting the index structure, including curl deletion

Scenario: if you want to delete only the data under the index without deleting the index structure, there is no postman tool in the (Windows Environment) server

First, only delete all the data in the index without deleting the index structure

POST 192.168.100.88:9200/my_index/_delete_by_query


get
{
  "query": {
    "match_all": {}
  }
}


Notes:
where my_index is the index name

Second, delete the specified data in the index without deleting the index structure

HEADER
DELETE 192.168.100.88:9200/log_index/log_type/D8D1D480190945C2A50B32D2255AA3D3


Notes.
where log_index is the index name, log_type is the index type, and D8D1D480190945C2A50B32D2255AA3D3 is the document id


Third: delete all data and index structure

DELETE 192.168.100.88:9200/my_index


Notes.
where my_index is the index name

Curl deletion in Windows

First, delete all data, including index structure

curl  -X DELETE "http://192.168.100.88:9200/my_index"

Second: delete all data without deleting index structure

curl  -XPOST "http://192.168.100.88:9200/log_index/_delete_by_query?pretty=true" -d "{"""query""":{"""match_all""": {}}}"

Among them: note when using curl (double quotation marks must be used in Windows Environment), single quotation mark will report the following error

“‘http” not supported or disabled in libcurl

C:\Users\admin>curl  -X DELETE 'http://192.168.100.88:9200/my_index'
curl: (1) Protocol "'http" not supported or disabled in libcurl