Tag Archives: Echarts-for-React

Echarts-for-React Example (Install, Import and Effect)

Install

npm install echarts-for-react –save


Import

import ReactEcharts from “echarts-for-react”;


Example Codes:

import React from 'react'
import ReactEcharts from 'echarts-for-react'
class Demon extends React.Component {
  state = {option: {}};
  render () {
    return (
      <>
        <ReactEcharts option={this.state.option} />
      </>
    );
  }
  componentDidMount () {
    let option = {
      xAxis: {
        type: 'category',
        data: ['Mon', 'Tue', 'Wed', 'Thu', 'Fri', 'Sat', 'Sun']
      },
      yAxis: {
        type: 'value'
      },
      series: [
        {
          data: [120, 200, 150, 80, 70, 110, 130],
          type: 'bar',
          showBackground: true,
          backgroundStyle: {
            color: 'rgba(180, 180, 180, 0.2)'
          }
        }
      ]
    };
    this.setState({option})
  }
}
export default Demon;


Effect:


Note:

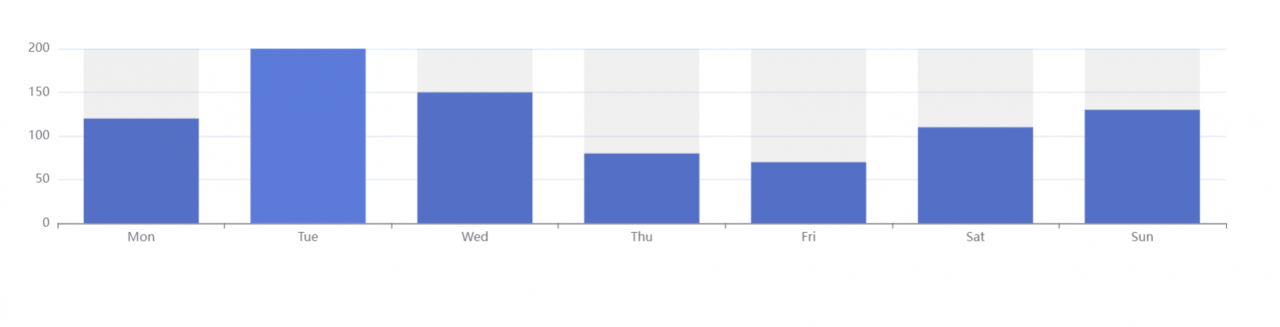
The x-axis in the grid of the xAxis indicator

yAxis indicator coordinate system y-axis in grid

series series chart configuration He decides which type of chart to display