The background,
The business needs to aggregate the data by grouping the results within the group by its own defined calculation method
Second, code implementation
 The reference code is as follows:
The business needs to aggregate the data by grouping the results within the group by its own defined calculation method
Second, code implementation
The reference code is as follows:
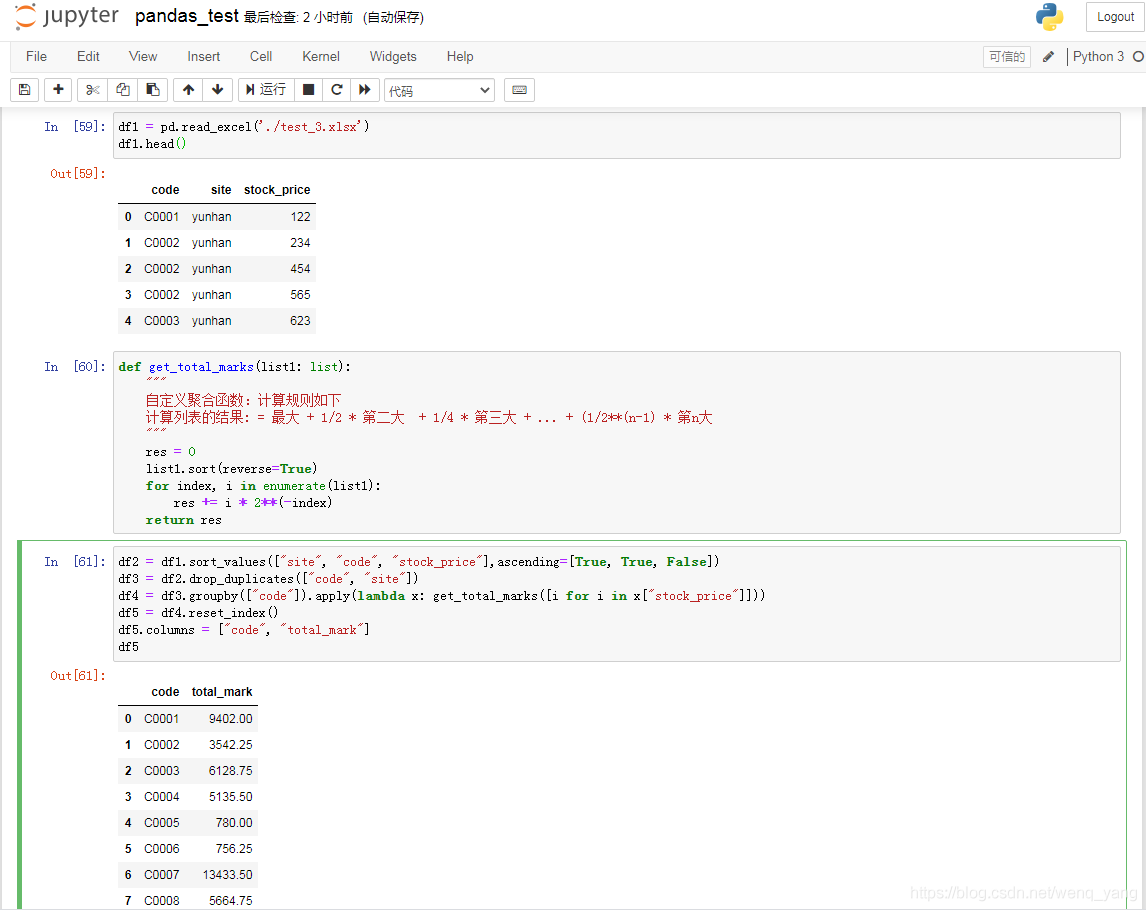
# Read source files
df1 = pd.read_excel('./test_3.xlsx')
df1.head()

# Custom aggregate functions
def get_total_marks(list1: list):
    """
    Custom aggregate functions: Calculate the rules as follows
    Result of calculating the list: = largest + 1/2 * second largest + 1/4 * third largest + ... + (1/2**(n-1) * nth largest
    """
    res = 0
    list1.sort(reverse=True)
    for index, i in enumerate(list1):
        res += i * 2**(-index)
    return res

# Using dataframe aggregation

df2 = df1.sort_values(["site", "code", "stock_price"],ascending=[True, True, False])
df3 = df2.drop_duplicates(["code", "site"])
df4 = df3.groupby(["code"]).apply(lambda x: get_total_marks([i for i in x["stock_price"]]))
df5 = df4.reset_index()
df5.columns = ["code", "total_mark"]
df5
After groupBY, you can use the Apply () method, which allows you to pass in a function. If the normal sum(), Max (), and mean() do not satisfy your needs, you can consider custom functions to complete the aggregation.