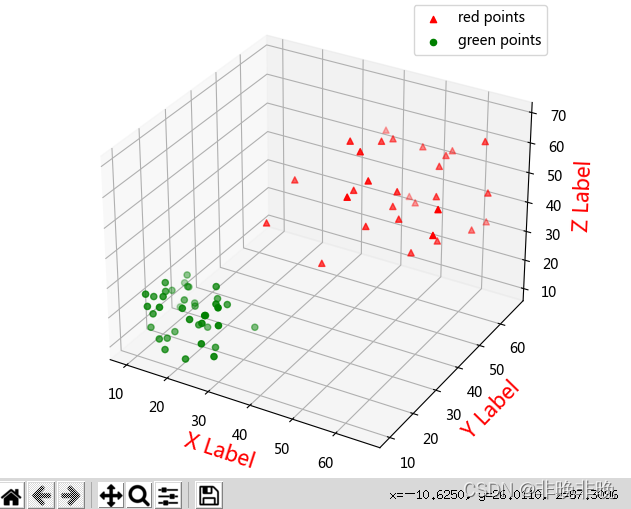
In the following code, it is shown that two different color scatter plots are drawn at the same time in the same coordinate system
import numpy as np
import matplotlib.pyplot as plt
from mpl_toolkits.mplot3d import Axes3D

#Generate random data
data1 = np.random.randint(30, 70, size=(30, 3)) #30*3 dimensional random integers of [30,70]
data2 = np.random.randint(10, 30, size=(40, 3)) #40*3 dimensions of [10, 30] random integers

x1 = data1[:, 0]
y1 = data1[:, 1]
z1 = data1[:, 2]

x2 = data2[:, 0]
y2 = data2[:, 1]
z2 = data2[:, 2]


# Plot a scatter plot
fig = plt.figure()
ax = Axes3D(fig)

'''
marker: shape, default round ball ('^' inverted triangle shape.)
c:color, default cyan

'''
ax.scatter(x1, y1, z1, c='r', marker = "^", label='red points')
ax.scatter(x2, y2, z2, c='g', label='green points')

# Plot the legend
ax.legend(loc='best')

# Add axes
ax.set_zlabel('Z Label', fontdict={'size': 15, 'color': 'red'})
ax.set_ylabel('Y Label', fontdict={'size': 15, 'color': 'red'})
ax.set_xlabel('X Label', fontdict={'size': 15, 'color': 'red'})
plt.show()
The results show that:
