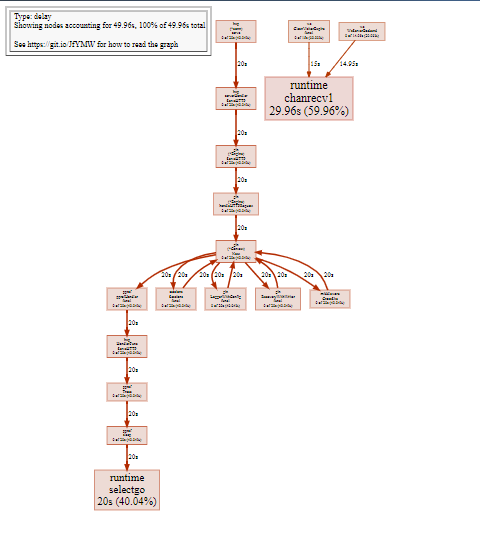
When using PProf is not too detailed, you can use trace to view the trace.
This command can be used with PProf
Download the trace file first
curl http://domain name/debug/pprof/trace?seconds=20> trace.out
use
go tool trace C:\Users\shihan1\Downloads\trace.out
Because it is monitoring 127.0.0.1, it may be inconvenient to access on the server line
To use this tool, you need to install graphviz first
Windows system can go here to download, pay attention to check and add environment variables during installation, otherwise you need to manually add
http://www.graphviz.org/download/#windows
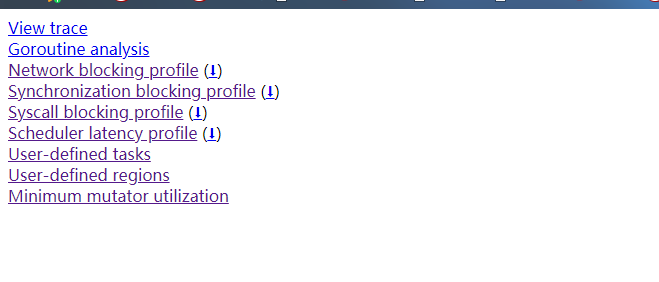
You can see the analysis by visiting the address
Read More:
- [Go]Understand the golang project performance analysis tool PProf
- How to Set Time Zone in Golang
- Golang: How to determine structure whether it is empty
- Golang: How to Read File All Content in one time
- [vite] Failed to parse source for import analysis because the content contains invalid JS syntax.
- [Solved] Error spawn CMD enoent errno when starting Vue project: – 4058
- [Solved] Vue project deploys nginx to refresh the interface 404 Error
- [Solved] Vue Start Project Error: ValidationError: webpack Dev Server Invalid Options
- [Solved] Project Package Error: Javascript heap out of memory
- [Solved] Vue Project Startup Error: getaddrinfo ENOTFOUND xxx
- Vue scaffold creation project and run error [Solved]
- CRA 5.0.0 Add Proxy Project Start Error [How to Solve]
- Vue Project Error: Error from chokidar [How to Solve]
- When starting Vue project: cannot find module ‘webpack cli/bin/config yargs’ error resolution
- error: Vue Project lang=“less“ Error [How to Solve]
- [Solved] Vue Less error: Webpack project report expected indentation of 0 spaces but found 2
- [Solved] Vue Project startup error: no eslint configuration found
- JS getting ${pageContext.request.contextPath} Get the root path of the project
- The vue3 project Error: Cannot find module’vue-loader-v16/package.json’
- VScode vue3 Project vetur Error [How to Solve]