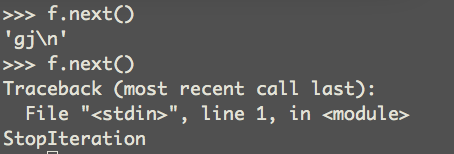
The iterator next () raises a StopIteration() exception
after all lines have completed
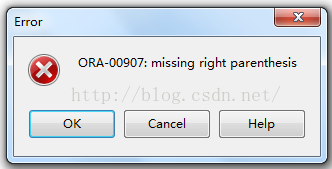
2. Error reason
create table t_stu_info(
    id int(10) primary key,
    name varchar2(20) not null
 );
Error, missing close parenthesis, int(10)
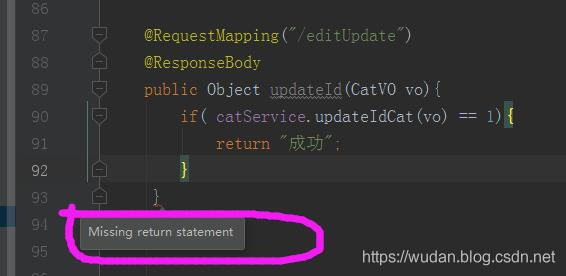
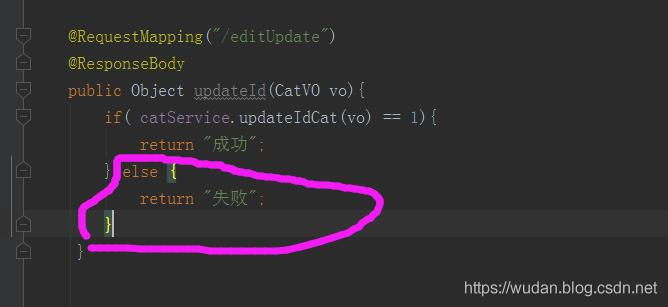
3. Solutions
create table t_stu_info(
    id int primary key,
    name varchar2(20) not null
 );
After removing the length of the data type after ID, no error will be reported; The ID data type length was also bracketed, but the Oracle client still prompts for an error
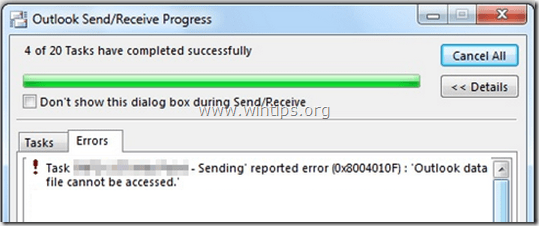
In a customer’s computer, the following error appeared during “Send/Receive Progress” in Outlook 2013 “Sending reported error (0x8004010F) : ‘Outlook data file cannot be accessed. ’” The above error may occur if the Outlook profile is corrupted or after transferring the Outlook .PST file to another location on your disk or to another computer.
After doing some research, I finally found a simple solution to resolve “Outlook data file cannot be accessed” error:
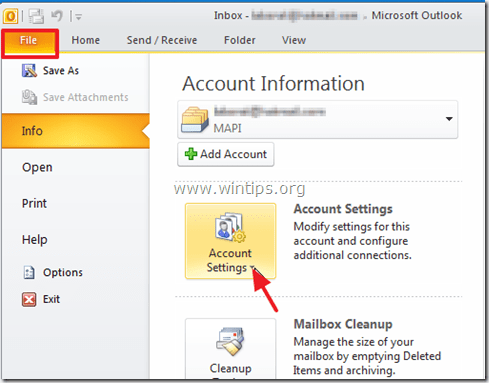
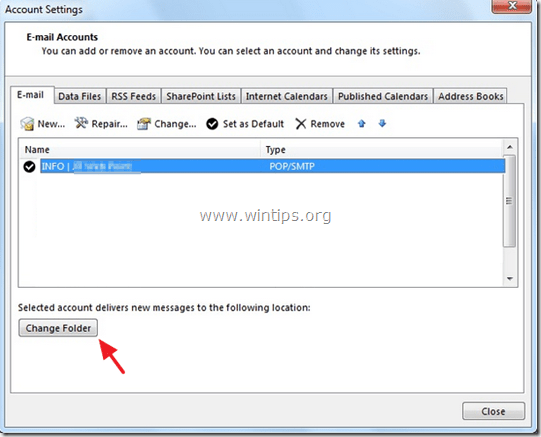
1. Open Outlook “Account Settings”.
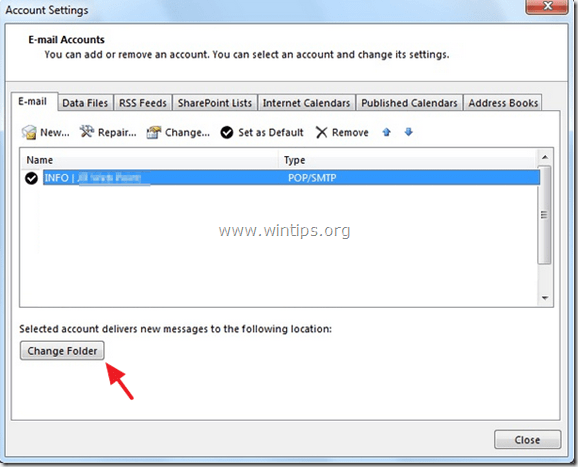
2. At “E-mail” tab, highlight the account with the problem and click “Change Folder”.
3. Click “New Outlook Data File”.
4. Give a name for the new data file (e.g. “TEST”) and press “OK”.
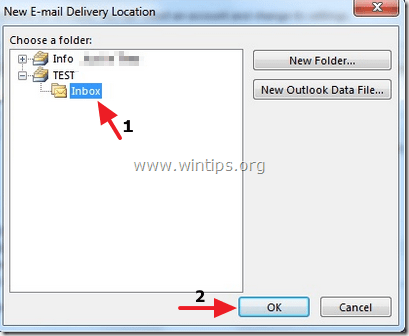
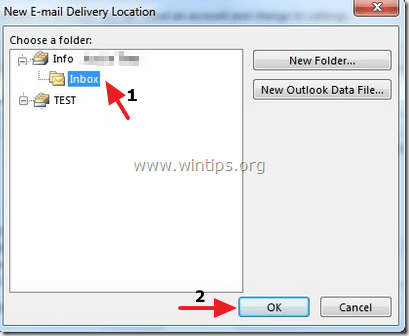
5. Expand the new data file (e.g. “TEST”) and select the “Inbox” subfolder. Choose “OK”.
6. While at Account Settings screen, click “Change Folder” again.
7. This time select the correct data file and folder that you want to store e-mail messages and choose “OK”.
8. Close “Account Settings” and click “Send/Receive”.
I saw it in the log folder where the Adobe PDF print went wrong.
error due to missing font
correction steps: go to the control panel — printer — PDF printer — right click — Adobe PDF Settings — Rely on system fonts only; Do not use Document Fonts option removed.
>>> from libtiff import *
Generating '/usr/local/lib/python2.7/dist-packages/libtiff/tiff_h_4_0_6.py'
Traceback (most recent call last):
  File "<stdin>", line 1, in <module>
  File "/usr/local/lib/python2.7/dist-packages/libtiff/__init__.py", line 20, in <module>
    from .libtiff_ctypes import libtiff, TIFF, TIFF3D
  File "/usr/local/lib/python2.7/dist-packages/libtiff/libtiff_ctypes.py", line 102, in <module>
    f = open(fn, 'w')
IOError: [Errno 13] Permission denied: '/usr/local/lib/python2.7/dist-packages/libtiff/tiff_h_4_0_6.py'
(1) : Linux system permission, enter root mode, modify the permission
chmod 777 /usr/local/lib/python2.7/dist-packages/libtiff/tiff_h_4_0_6.py(2) : Modify folder permissions in Win7 or Win10 systems.
This is dvips(k) 5.95a Copyright 2005 Radical Eye Software (www.radicaleye.com)
‘ TeX output 2008.09.16:1816’ -> work-summary-08_09.ps
<tex.pro><texps.pro>. <cmti10.pfb><cmti12.pfb><cmmi10.pfb><cmr7.pfb> lpr: Error – no default destination available.
lpr is about printer or print file
Because I have no printer connected to my PC, so I did below:
#texconfig
Then:
->choose dvips,
->choose Dest,
->press enter (so that dvips destination can be a file, instead of a printer).
Problem description: An error occurred while Windows was synchronizing with time.windows.com
Or An error occurred while Windows was Synchronizing with 10.80.2.80 (internal time server)
Solutions:
The original link: http://madman.blog.51cto.com/62132/418537
Reproduced in: https://blog.51cto.com/hunkz/1704211

Relative Absolute error and Root Relative Squared error: For example, when the actual value is 500 and the predicted value is 450, the absolute error is 50. When the actual value is 2 and the predicted value is 1.8, the absolute error is 0.2. The two Numbers 50 and 0.2 have a big difference, but the error rate expressed is 10%, so sometimes the absolute error cannot reflect the true size of the error, while the relative error reflects the error size by reflecting the proportion of the error in the truth value, which is more effective.
for details, please refer to
TP, FP:
TP represents the recognition rate, the probability of identifying an instance of a class. Improving the recognition rate is very important in the medical system, if the patient is sick, but not recognized, the consequences are very serious! FP represents the miscalculation rate, and how much probability is there to classify the instance identification cost for instances of other classifications.
Precision: Exactly. Represents the ratio of the correct number of instances to the total number in a classification of a category. That’s TP over TP plus FP.
-Leonard: What’s the Recall rate?Represents the number of instances that are correctly identified as the total number of instances in the class. Since there are no unrecognized instances in this example, Recall=TP.
F – Measure:
This value is a combination of precision and recall rate, in real life is often a trade-off between precision and recall rate, so the introduction of the F value, F value, the greater the precision and recall rate is relatively high, see: http://baike.baidu.com/link?Url = 3 motzt44pst0quciabcnqnihv – RI3XrfldYTZrPRxq6uEnttl – IQnVC – c2HOJ3jTvAXgXKSi3htc86bsamPoQq
Accuracy (= ACC) :
Accuracy
ROC Area: The ROC Area is generally greater than 0.5. The closer this value is to 1, the better the classification effect of the model is. This value has a low accuracy at 0.5-0.7, a certain accuracy at 0.7-0.9, and a high accuracy above 0.9. If the value is equal to 0.5, the classification method is completely ineffective and has no value.
Confusion Matrix: the “7” of the first row means that seven instances of the A case are correctly classified, and the “2” of the first row means that two of the A cases are incorrectly classified as B.
The “3” in the second row means that there are 3 instances of B that were misclassified, and the “2” in the second row means that there are 2 cases of B that were correctly classified.
Note that Correction coefficient applies only to the continuous value category and Accuracy only to the discrete category
Kappa statistic:
The Kappa statistical index has the degree of difference between the classification results of the classifier and the random classification. K=1 indicates that the classifier is completely different from random classification, K=0 indicates that the classifier is identical with random classification (i.e., the classifier has no effect), and K=-1 indicates that the classification is worse than random classification. Generally speaking, the results of the Kappa statistical index are positively correlated with the AUC index and accuracy of the classifier, so the closer the value is to 1, the better.
Mean Absolute error:
This indicator is used to evaluate the difference between the predicted value and the actual value. The degree to which the measured values are close to each other is called precision. Precision is expressed by deviation, which refers to the difference between the measured value and the average value. The smaller the deviation, the higher the precision.
Root mean square Error: RMSE:
The square root of the mean sum of squares with weighted residuals as a numerical indicator for measuring accuracy under certain conditions. The mean error is a numerical measure of observation accuracy, also known as “standard deviation” or “root-mean-square difference”. The square root of a number in the square of a set of true errors under the same observation conditions. Since the true error is not easy to find, the observed correction usually obtained by the least square method is used to replace the true error. It’s the square root of the square root of the deviation between the observed value and the truth value and the ratio of the observed number n. The mean error is not equal to the true error, it is just a representative value of a set of true errors. The mean error reflects the accuracy of the group of observed values. Therefore, the mean error is usually called the mean error of the observed values.
Coverage of cases:
The coverage of the case, which is the coverage of all instances by the classification rules used by the classifier, the higher the percentage, the more effective the rule is.