Motion problems usually occur in a moment, and may not exist in the next second. So how to position this kind of problem?First of all, we should be able to collect the relevant system information at the moment of the problem.
atop
For a problem, we can find the direction of the problem from a macro point of view. We can install an atop and configure it to record the system information in 1s granularity. In this way, when jitter occurs, we can trace back the system monitoring information. From a macro point of view, we can see which module may have problems, such as IO, MEM or network.
yum -y install atop
After the installation, configure the sampling frequency to 1 second
cat /etc/sysconfig/atop
LOGOPTS=""
LOGINTERVAL=1
LOGGENERATIONS=28
LOGPATH=/var/log/atop
Start atop service:
service atop start
After running, atop will record the system monitoring information to the/var/log/atop directory. When jitter occurs, it will trace back through the log file saved in it
atop -r atop_20210715
perf
If you view atop, you can see the resource information of the system. You can know the direction of possible problems through these information. However, atop alone may not be enough to accurately locate the problem. Therefore, perf needs to capture more trace information. For perf, directly grasping hot spots may have a great impact on the performance of the system. Here we need to consider a lightweight sampling method. We can pass in – F to specify the sampling frequency to collect perf hotspots.
perf record -g -a -F 99
99 sampling points will be collected every second, and the impact on the system can be controlled, so you can try to capture information for a long time to ensure that data can be viewed in case of failure. There is also a problem here. If the data collected by perf is for a period of time, then the instantaneous jitter will be counted in a long time range, which may not reflect the problem point. Another function of perf needs to be used here, that is – time view by time range:
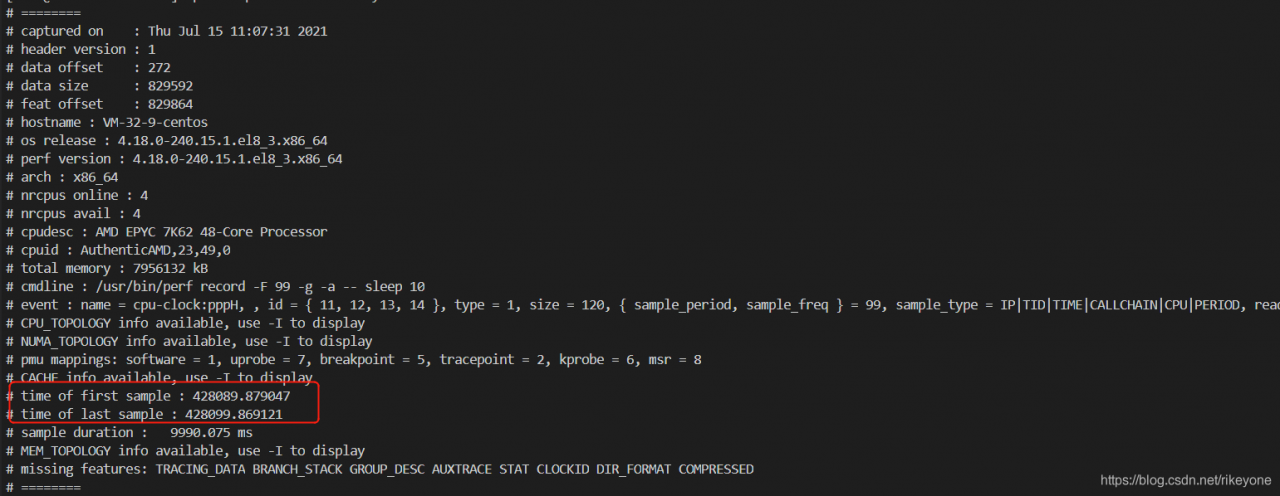
perf report --header-only
perf report --time  start,end
The first command can view the start time and end time of the current data captured by perf. Then, the time when the fault occurs can be calculated according to this, and the second command can intercept one of the segments for report analysis
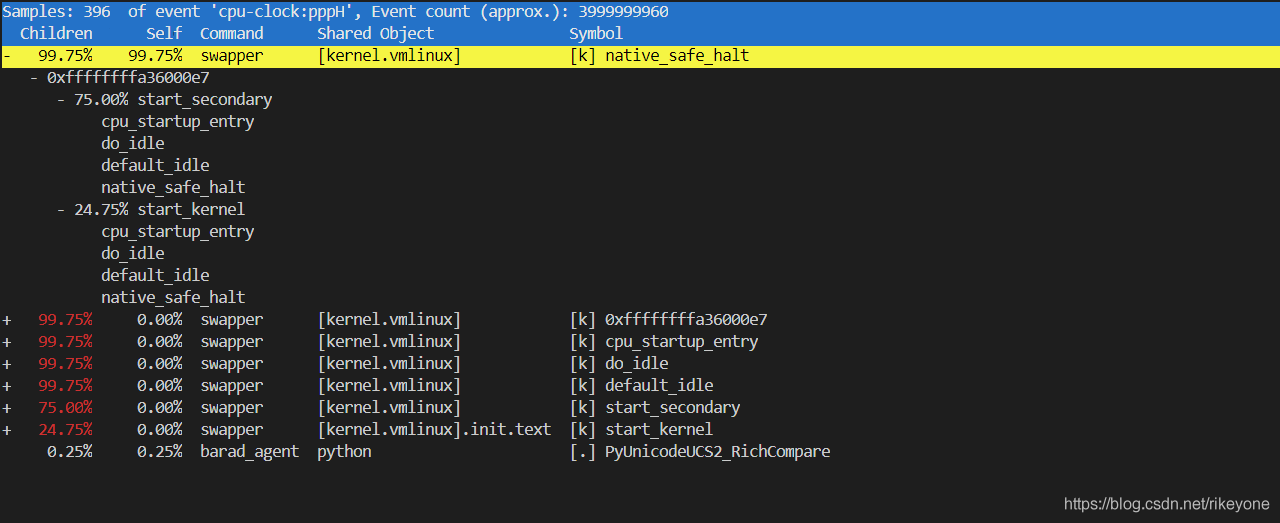
For example, if you want to view the hot spot information captured by perf in the first 1s:
perf report --time 428090,428091