When the browser executes document.getElementById(‘chart’), because the dom object with the id of main has not been created, it reports an error Initialize failed: invalid dom.
The solution is to delay the execution of the code for initializing the charts in echarts, which is fast and does not affect the display of the effect and does not feel stuck.

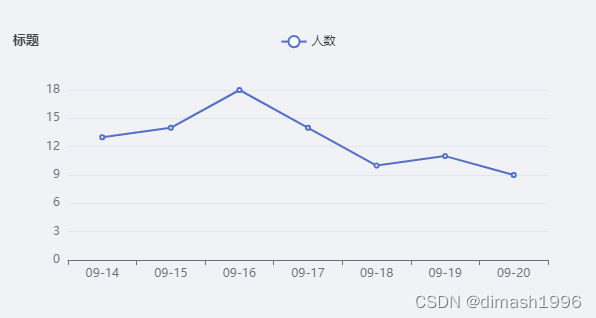
func.echarts() for the initialization of the chart function , code and effects are as follows (a vue3.0 project of a page used)
     echarts: () => {
        let myChart = echarts.init(document.getElementById("chart"));
        let option = {
          title: {
            text: '标题',
            textStyle: {
              fontSize: 13
            },
          },
          toolbox: {
            show: true,
            feature: {
              saveAsImage: {
                show: false
              }
            },
          },
          legend: {
            data: ['人数']
          },
          xAxis: {
            data: ['09-14', '09-15', '09-16', '09-17', '09-18', '09-19', '09-20']
          },
          yAxis: {},
          series: [{
            name: '人数',
            type: 'line',
            data: ['13', '14', '18', '14', '10', '11', '9'],
          }]
        };
        myChart.setOption(option);
      },
    })