1. Some errors are reported in the production environment
The information is as follows:
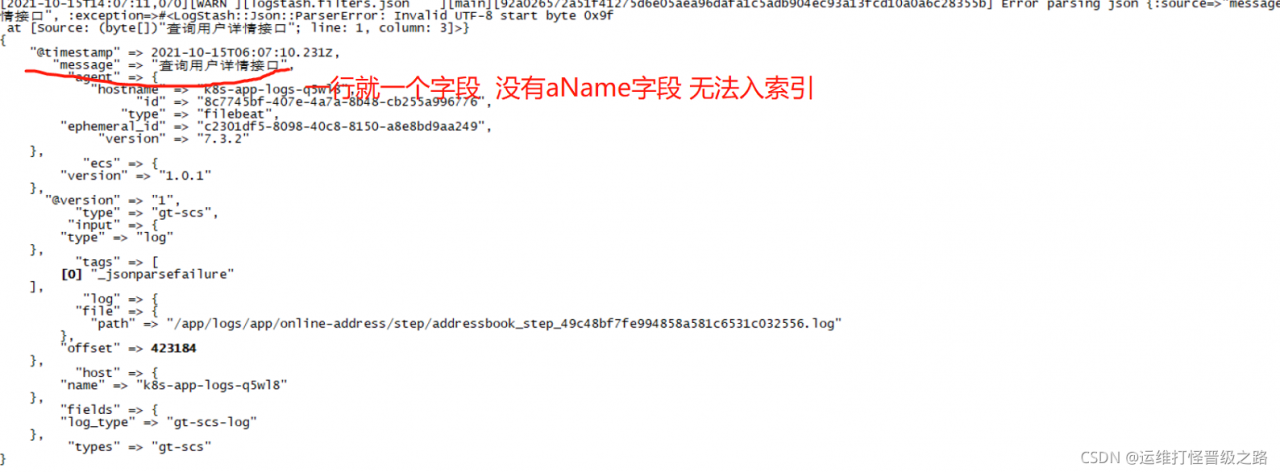
2021-10-15T15:49:28,932][WARN ][logstash.filters.json    ][main][7e17a3dc7e2c6df08ed7012ca6bfe17e3277d05d745f2c5bf55d2b01b151e25b] Error parsing json {:source=>"message", :raw=>"查询用户详情接口", :exception=>#<LogStash::Json::ParserError: Invalid UTF-8 start byte 0x9f
 at [Source: (byte[])"Query user details interface"; line: 1, column: 3]>}
[2021-10-15T15:49:28,946][ERROR][logstash.outputs.elasticsearch][main][862f1cf74fcefb4312e0b0aa2e9fdf074e2e77c675e5c24e9b7a04d1054f1947] Could not index event to Elasticsearch. {:status=>400, :action=>["index", {:_id=>nil, :_index=>"%{aName}-log_2021_10", :routing=>nil, :_type=>"_doc"}, #<LogStash::Event:0x6527baeb>], :response=>{"index"=>{"_index"=>"%{aName}-log_2021_10", "_type"=>"_doc", "_id"=>nil, "status"=>400, "error"=>{"type"=>"invalid_index_name_exception", "reason"=>"Invalid index name [%{aName}-log_2021_10], must be lowercase", "index_uuid"=>"_na_", "index"=>"%{aName}-log_2021_10"}}}}
[2021-10-15T15:49:29,446][WARN ][logstash.filters.json    ][main][52e7421840cd9e07ac4081f9b005972562be1954f89c4f4bc5e30c5c19ebae78] Error parsing json {:source=>"message", :raw=>"spAuthAttributes ==========> {\"chainCodes\":\"60d9acb97314488689b899f4495e0857,3d01cb64635b46d4955606e6b356af70,c3283b04c2ad48a09d770b5a96b96a4c,850ff333c6664138b38344a75545ce8e\",\"customLoginStyle\":\"default\",\"samlEntityID\":\"portal\",\"securityLevel\":\"1\",\"spCode\":\"portal\",\"spLocalLogoutUrl\":\"\",\"spName\":\"portal\",\"spOsType\":0,\"tokenValidPeriod\":36000,\"url\":\"https://i.gt.cn\",\"userAttr\":\"\"}", :exception=>#<LogStash::Json::ParserError: Unrecognized token 'spAuthAttributes': was expecting ('true', 'false' or 'null')
 at [Source: (byte[])"spAuthAttributes ==========> {"chainCodes":"60d9acb97314488689b899f4495e0857,3d01cb64635b46d4955606e6b356af70,c3283b04c2ad48a09d770b5a96b96a4c,850ff333c6664138b38344a75545ce8e","customLoginStyle":"default","samlEntityID":"portal","securityLevel":"1","spCode":"portal","spLocalLogoutUrl":"","spName":"portal","spOsType":0,"tokenValidPeriod":36000,"url":"https://i.gt.cn","userAttr":""}"; line: 1, column: 18]>}
[2021-10-15T15:49:29,447][WARN ][logstash.filters.json    ][main][52e7421840cd9e07ac4081f9b005972562be1954f89c4f4bc5e30c5c19ebae78] Error parsing json {:source=>"message", :raw=>"redis执行时间:{}1", :exception=>#<LogStash::Json::ParserError: Unrecognized token 'redis执行时间': was expecting ('true', 'false' or 'null')
 at [Source: (byte[])"redis execution time: {}1"; line: 1, column: 21]>}
2. Processing method
this is because the log is not printed as required during processing. We need to open a new logstash to print the abnormal log
the configuration is as follows:
[root@k8s-master1 conf.d]# more aName1.conf
input{
    kafka{
           bootstrap_servers => "10.152.17.50:9092"
           group_id => "gt-scs-log-new"
           topics => "gt-scs-log"
           consumer_threads => 1
           decorate_events => true
           auto_offset_reset => "latest"
           type => "gt-scs"
    }
}
filter {
    if [type] == "gt-scs" {
      mutate {
                add_field => { "types" => "%{type}"}
             }
      json {
                source => "message"
          }
      json {
                source => "message"
          }

    }
}
output {
  if [tags] {
        stdout {
                codec => "rubydebug"
        }
  }
}
3. Results
Read More:
- How to use it RegAsm.exe Register C in a development / production environment#/ VB.NET Developed DLL
- npm ERR! registry error parsing json error report solution
- Err: error parsing query: found name, expected identifier, string
- Parsing the exception of storing JSON string in cookie
- [development experience] solution to unexpected syntax error: unexpected identifier in JSON parsing
- Parsing double quotation marks with JSON
- Gson Parsing exceptions: Use JsonReader.setLenient(true) to accept malformed JSON at line 1 column 1 path $
- Using JSON to report errors
- 【ipfs-api】npm ERR! JSON.parse package.json must be actual JSON, not just JavaScript.
- The solution of “double quotation marks become escape characters” in Java parsing JSON
- Error report on next page of GridView query view
- CONDA failed to create environment (collecting package metadata(repodata.json): failed)
- “No nodes available to run query” is reported when using Presto to connect to MySQL query“
- An error occurs when es logstash is installed and running
- Serverlet: How to Add, Delete, Modify and Query item code
- [Solved] Logstash Error: Bad file descriptor
- Unable to read workspace file ‘D:\angular.json‘: Invalid JSON character: “ “ at
- Anaconda create environment, delete environment, activate environment, exit environment
- VScode: How to Fix “Comments are not permitted in JSON” issue
- How to Fix Spring Boot OTS parsing error: Failed to convert WOFF 2.0