Error: output with shape [1, 224, 224] don’t match the broadcast shape [3, 224, 224]
the image input by the original model is RGB three channel, and the input is single channel gray image.
# Error:output with shape [1, 224, 224] doesn't match the broadcast shape [3, 224, 224]
# The input image of the original model is RGB three-channel, and the one I input is a single-channel grayscale image.
# #------------------------------------------------ --------------------------------------
# from torch.utils.data import DataLoader
# dataloader = DataLoader(dataset, shuffle=True, batch_size=16)
# from torchvision.utils import make_grid, save_image
# dataiter = iter(dataloader)
# img = make_grid(next(dataiter)[0], 4) # Assemble a 4*4 grid image and convert it into 3 channels
# to_img(img)
# #-------------------------------------------------------------------------------------
# It seems that make_grid cannot be converted to 3 channels
The solution is as follows:
from torch import nn
from torchvision import datasets
from torchvision import transforms as T
from torch.utils.data import DataLoader
from torchvision.utils import make_grid, save_image
import numpy as np
import matplotlib.pyplot as plt
transform = T.Compose([
T.ToTensor(), #This will convert a numpy array between 0 and 255 into a floating point tensor between 0 and 1
T.Normalize((0.5, ), (0.5, )), #In the normalize() method, we specify the mean of all channels of the normalized tensor image, and also specify the central deviation.
])
dataset = datasets.MNIST('data/', download=True, train=False, transform=transform)
dataloader = DataLoader(dataset, shuffle=True, batch_size=100)
print(type(dataset[0][0]),dataset[0][0].size())
# print(dataset[0][0])
# To draw a tensor image, we must change it back to a numpy array.
# We will do this in the function def im_convert(), which contains a parameter that will become a tensor image.
def im_convert(tensor):
image=tensor.clone().detach().numpy()
# The new tensor obtained using torch.clone() and the original data no longer share memory, but still remain in the calculation graph,
# The clone operation supports gradient transfer and superposition without sharing data memory, so it is commonly used in scenarios where a unit in a neural network needs to be reused.
# Usually if the requirements_grad of the original tensor=True, then:
# tensor requires_grad=True after clone() operation
# The tensor requires_grad=False after the detach() operation.
image=image.transpose(1, 2, 0)
# The tensor to be converted to a numpy array has the shape of the first, second and third dimensions. The first dimension represents the color channel, and the second and third dimensions represent the width and height of the image and pixels.
# We know that each image in the MNIST dataset is a grayscale corresponding to a single color channel, and its width and height are 28 * 28 pixels. Therefore, the shape will be (1, 28, 28).
# In order to draw an image, the shape of the image is required to be (28, 28, 1). Therefore, by swapping axis zero, one and two
print(image.shape)
image=image*(np.array((0.5, 0.5, 0.5))+np.array((0.5, 0.5, 0.5)))
print(image.shape)
# We normalize the image, and before we have to normalize it. Normalization is done by subtracting the average value and dividing by the standard deviation.
# We will multiply by the standard deviation, and then add the average
image=image.clip(0, 1)
print(image.shape,type(image))
return image
# To ensure the range between 0 and 1, we use clip()
# Function and passed zero and one as parameters. We apply the clip function to the minimum value 0 and maximum value 1 and return the image.
# It will create an object that allows us to pass through a variable training loader at a time.
# We access one element at a time by calling next on the dataiter.
# next() function will get our first batch of training data, and the training data will be divided into the following images and labels
dataiter=iter(dataloader)
images, labels=dataiter.next()
fig=plt.figure(figsize=(25, 6))
#fig=plt.figure(figsize=(25, 4)) #Picture output width is smaller than above
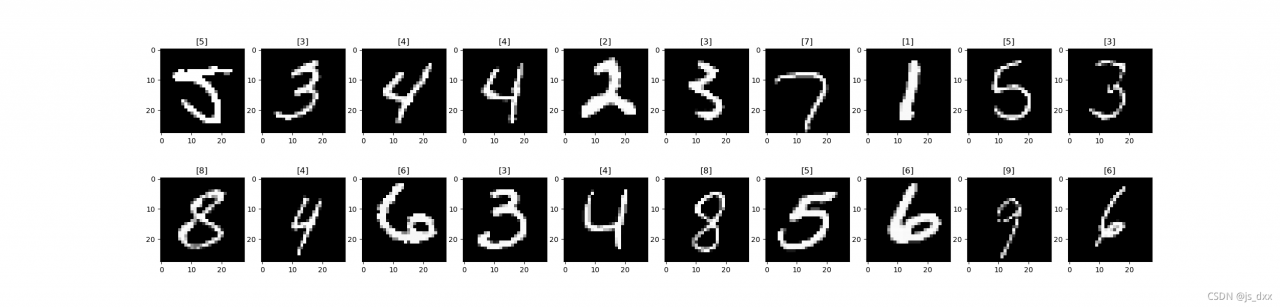
for idx in np.arange(20):
ax=fig.add_subplot(2, 10, idx+1)
plt.imshow(im_convert(images[idx]))
ax.set_title([labels[idx].item()])
plt.show()The final results are as follows:
Read More:
- [Solved] Mindspot error: Error: runtimeerror:_kernel.cc:88 CheckParam] AddN output shape must be equal to input…
- [Solved] Pytorch-transformers Error: AttributeError: ‘str‘ object has no attribute ‘shape‘
- How to Solve attributeerror: ‘list’ object has no attribute ‘shape‘
- [Solved] mmdetection benchmark.py Error: RuntimeError: Distributed package doesn‘t have NCCL built in
- [Solved] Sudo doesn‘t work: “/etc/sudoers is owned by uid 1000, should be 0”
- Using postman Test Django Interface error: RuntimeError:You called this URL via POST,but the URL doesn‘t end in a slash
- [Solved] Pandas rename Error: ValueError: operands could not be broadcast together with shapes (1,2) (3,) (1,2)
- How to Solve Pytorch DataLoader Loading Error: UnicodeDecodeError: ‘utf-8‘ codec can‘t decode byte 0xe5 in position 1023
- [Solved] RuntimeError: The size of tensor a (4) must match the size of tensor b (3) at non-singleton dim
- [Solved] YOLOv4 Error: Layer before convolutional layer must output image.: No error
- pytorch DDP Accelerate Error: [W reducer.cpp:362] Warning: Grad strides do not match bucket view strides.
- Python uses try… Except… To output detailed errors
- python: File Processing and Input and Output
- [Solved] Pytorch Tensor to numpy error: RuntimeError: Can‘t call numpy() on Tensor that requires grad.报错
- How does Python output colored fonts in the CMD command line window
- [Solved] gym.error.NameNotFound: Environment PongNoFrameskip doesn’t exist.
- [Solved] RuntimeError: function ALSQPlusBackward returned a gradient different than None at position 3, but t
- [Solved] selenium.common.exceptions.WebDriverException: Message: unknown error: DevToolsActivePort file doesn
- Httprunner output assure Report
- [Solved] ERROR: THESE PACKAGES DO NOT MATCH THE HASHES FROM THE REQUIREMENTS FILE