PProf uses profile.proto to analyze data
Can collect command analysis when the program is executed
Run-time data analysis during HTTP service can be collected
Can be analyzed by go test test case
There are the following monitoring and analysis functions:
CPU analysis, memory analysis, blocking analysis, mutex analysis, Groutine analysis
If it is an http service, then it can be achieved by directly importing this package _ “net/http/pprof”
If you use the gin framework, you need to import this package github.com/gin-contrib/pprof
And register the gin object pprof.Register(g)
Directly visit http://service/debug/pprof/ through the browser
You can see the following page
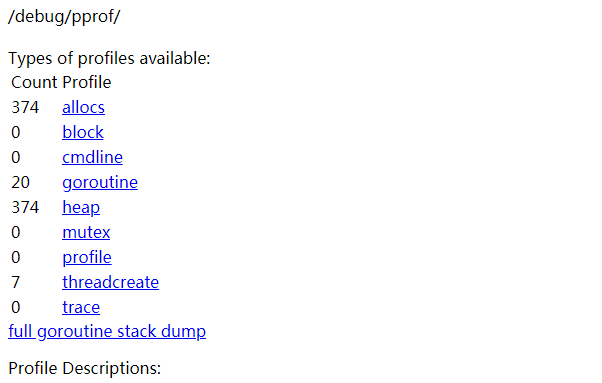
The meaning of each parameter is:
allocs: view all past memory allocation sample
blocks: view the stack trace that caused blocking synchronization
cmdline: the complete call path of the command line of the current program
goroutine: view all currently running goroutines stack trace
heap: view the memory allocation of active objects
mutex: View the stack trace
profile of the competing holder that caused the mutex lock : CPU Profiling is performed for 30s by default, and a profile file for analysis is obtained.
threadcreate: View the stack trace of creating a new OS thread
Use the interactive command line to analyze the results of the above URL
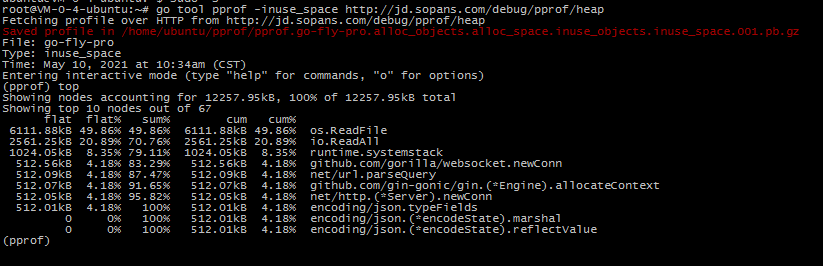
For example, analyze the resident memory situation
go tool pprof -inuse_space http://localhost:8081/debug/pprof/heap input top command
For example, analyze the temporary allocation of memory
go tool pprof -alloc_objects http://localhost:8081/debug/pprof/heap input top command

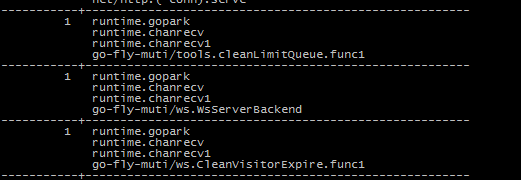
Analyze goroutine
go tool pprof http://localhost:6060/debug/pprof/goroutine You can use traces to see the call stack
The focus is on the independent goroutine that I opened myself, and the bottom one is the call function of the package I wrote.