Reason: the current user has limited the number of processes
solution:
Su root
(if the switch fails due to resource temporarily unavailable, you can log in with another user)
CD/etc/security/limits. D
VI 90 nproc. Conf
add a new line of current user with unlimited number of processes
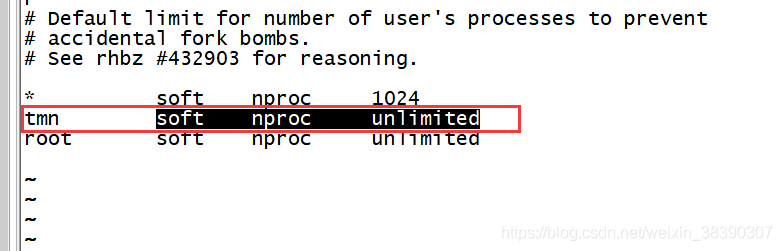 note: you need to log in again after modification
Tag Archives: The server
Ntpdate reported an error when updating the clock, and the problem of no server suitable for synchronization found was solved
When I encounter a problem, I just turn off the local ntpd service, because the ntpd service conflicts with ntpdate
systemctl stop ntpd
To solve the problem that windows Remote Desktop Services cannot copy and paste: restart rdpclip.exe
After connecting to the remote server, even if you select the “clipboard” function in the “local resources” tab, you still can’t copy and paste. The solution is found through Baidu, because the rdpclip.exe on the remote server doesn’t work properly. The solution is to open the task manager on the remote server, find the rdpclip.exe process, and close it.
Then enter rdpclip.exe in the start menu search box, press enter, and it will run again.
Mongodb caused 127.0.0.1:27017 unable to connect
The main reason is abnormal shutdown.
if you have abnormal shutdown operation, please try the following methods
mongod --dbpath /usr/local/mongodb/data --logpath /usr/local/mongodb/mongod.log --fork
Dbpath is your data configuration path
logpath is your log path
through this command, similar to windows restart services Service
Resolving yum source-related issues: Cannot retrieve metalink for repository: epel/x86_64. Please verify its path and try again
Loaded plug-ins: fastestmirror
Loading mirror speeds from cached hostfile
One of the configured repositories failed (none),
and yum doesn’t have enough cached data to continue. At this point the only
safe thing yum can do is fail. There are a few ways to work “fix” this:
 1. Contact the upstream for the repository and get them to fix the problem.

 2. Reconfigure the baseurl/etc. for the repository, to point to a working
    upstream. This is most often useful if you are using a newer
    distribution release than is supported by the repository (and the
    packages for the previous distribution release still work).

 3. Run the command with the repository temporarily disabled
        yum --disablerepo=<repoid> ...

 4. Disable the repository permanently, so yum won't use it by default. Yum
    will then just ignore the repository until you permanently enable it
    again or use --enablerepo for temporary usage:

        yum-config-manager --disable <repoid>
    or
        subscription-manager repos --disable=<repoid>

 5. Configure the failing repository to be skipped, if it is unavailable.
    Note that yum will try to contact the repo. when it runs most commands,
    so will have to try and fail each time (and thus. yum will be be much
    slower). If it is a very temporary problem though, this is often a nice
    compromise:

        yum-config-manager --save --setopt=<repoid>.skip_if_unavailable=true
Cannot retrieve metalink for repository: epel/x86_64. Please verify its path and try again
Follow the prompts to correct the source.
cd /etc/yum.repos.d
vi epel.repo
The revised contents are as follows:
[epel]
name=Extra Packages for Enterprise Linux 7 - $basearch
baseurl=http://mirrors.aliyun.com/epel/7/$basearch
#metalink=https://mirrors.aliyun.com/metalink?repo=epel-7&arch=$basearch
failovermethod=priority
enabled=1
gpgcheck=1
gpgkey=file:///etc/pki/rpm-gpg/RPM-GPG-KEY-EPEL-7

[epel-debuginfo]
name=Extra Packages for Enterprise Linux 7 - $basearch - Debug
baseurl=http://mirrors.aliyun.com/epel/7/$basearch/debug
#metalink=https://mirrors.aliyun.com/metalink?repo=epel-debug-7&arch=$basearch
failovermethod=priority
enabled=0
gpgkey=file:///etc/pki/rpm-gpg/RPM-GPG-KEY-EPEL-7
gpgcheck=1

[epel-source]
name=Extra Packages for Enterprise Linux 7 - $basearch - Source
baseurl=http://mirrors.aliyun.com/epel/7/SRPMS
#metalink=https://mirrors.aliyun.com/metalink?repo=epel-source-7&arch=$basearch
failovermethod=priority
enabled=0
gpgkey=file:///etc/pki/rpm-gpg/RPM-GPG-KEY-EPEL-7
gpgcheck=1
Execute the following command:
yum clean all
yum makecache
yum update
yum install -y git
Yum installation and use returned to normal.
Can’t connect to MySQL server on ‘192.168.64.132‘
Sqlog failed to connect to MySQL database in Linux system
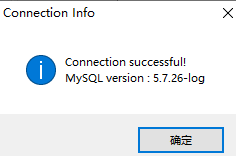
error message: can’t connect to MySQL server on ‘192.168.64.132’
It can be connected before, but it is not enough to install the virtual machine image. According to the data, you can use SSH connection, and the configuration is as follows:
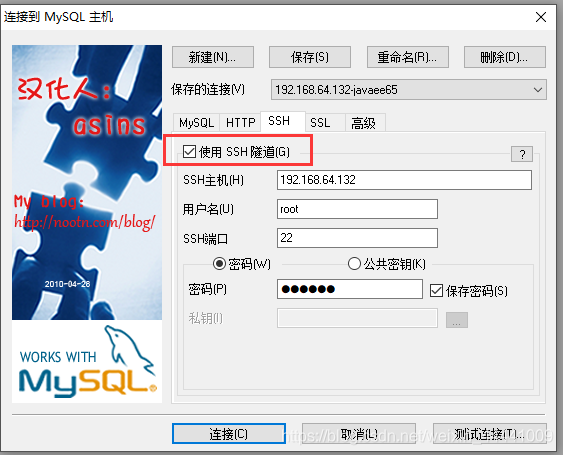
If you don’t use SSH connection, you need to use win’s telnet to test whether telnet 192.168.64.132 3306 and telnet 192.168.64.132 22 can connect
2, the virtual machine opens the firewall and does not expose port 3306( 22 can be connected, 3306 can not be connected).
Reference blog
Solve the problem of 404 Not Found error in nginx accessing dynamic interface
Problem description
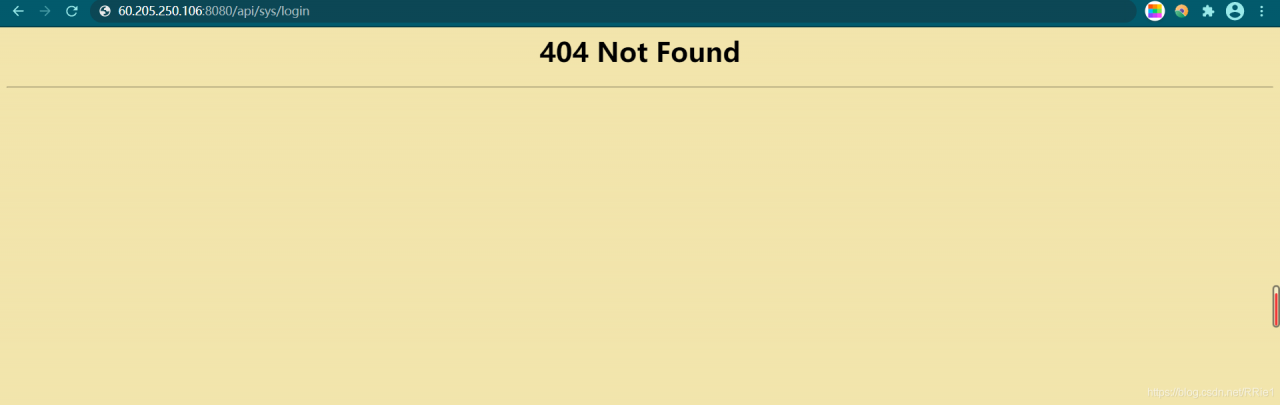
We design a set of recruitment back transfer system, and use ant design Vue and jfinal framework at the front and back end respectively. You want to deploy the project to the server, but external access always reports 404 not found
Solutions
The error is: the dynamic interface can not be found, but I don’t know whether there is a problem in the project or after nginx agent.
Therefore, it is necessary to test the interface of the project itself and the interface after nginx proxy.
First, test the interface in the project
Enter the command: curl on the Ubuntu side http://localhost :port/xxx/xxx
Here my interface is. curl http://localhost:20294/sys/login
Results of operation:
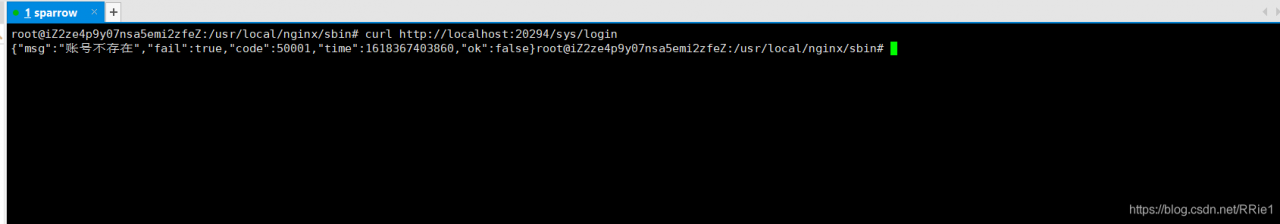
It shows that there is no problem with the interface in my project.
Test the interface after nginx proxy again
Then input the command in Ubuntu
curl http://localhost:8080/api/user/login
Running result:
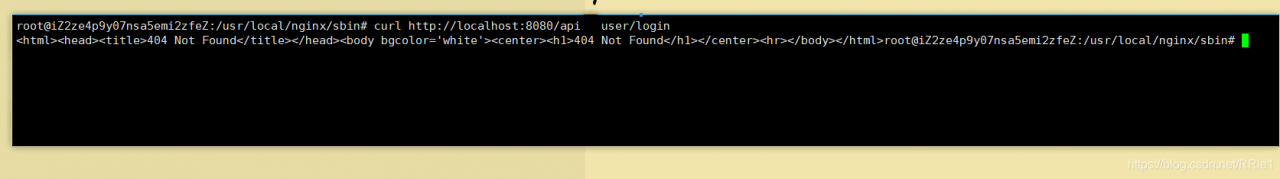
the prompt here is that the interface cannot be found, which indicates that the problem lies in the proxy server nginx, so we need to modify the configuration file of nginx.
According to the suggestions of other blogs, I added a slash to this place in nginx configuration
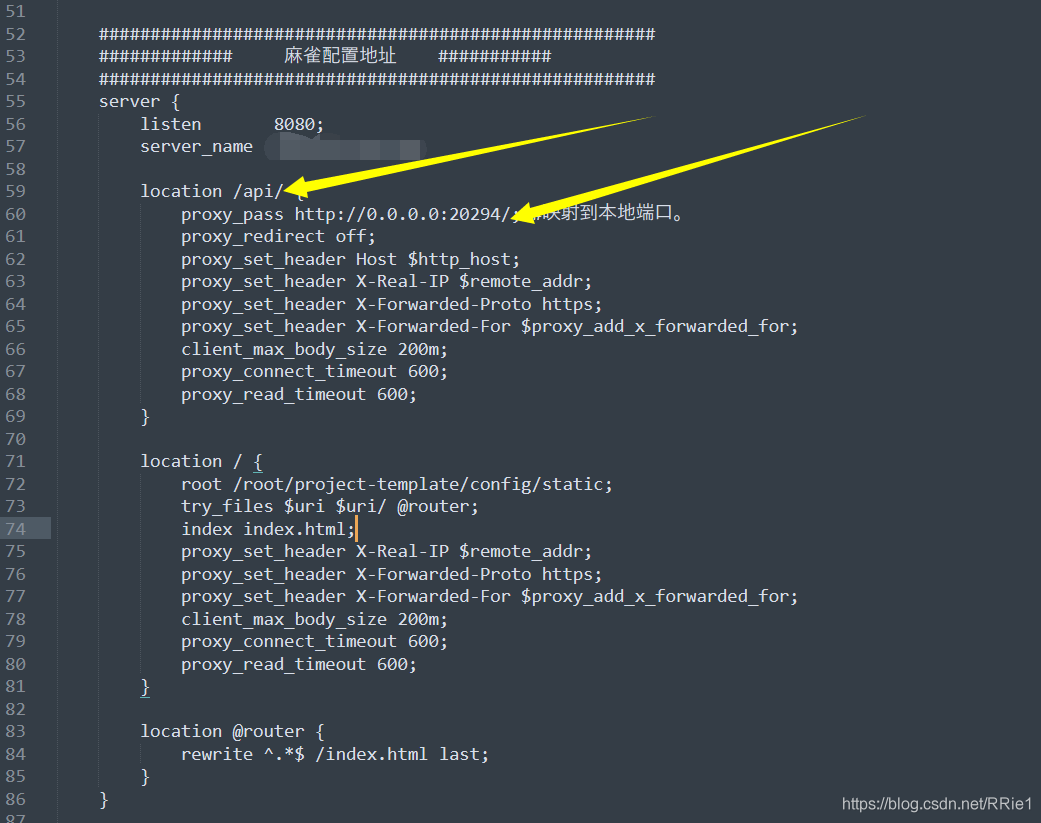
after restarting the server, it still can’t work.
Complete solution
When I didn’t know what to do, I suddenly found that there were two nginx in my server ····
I was wondering if it was because there were two nginx, and the modified configuration file was not the nginx I started. So I replaced all nginx configuration files with my original configuration files, and then restarted. Still not
Worried about the two nginxs, I deleted all nginxs in the server. Delete steps (run the following steps in turn:
ps aux|grep nginx  #View nginx processes
kill -9 process number #Kill the nginx queried in the previous step (process number is in the second column)
find/-name nginx #Find the nginx file address
rm -rf xxx #Delete all nginx files
Finally, use weget to install the new nginx, and then install it according to the original installation steps. After modifying the configuration file, run curl to access the dynamic interface. All of a sudden, it’s OK!
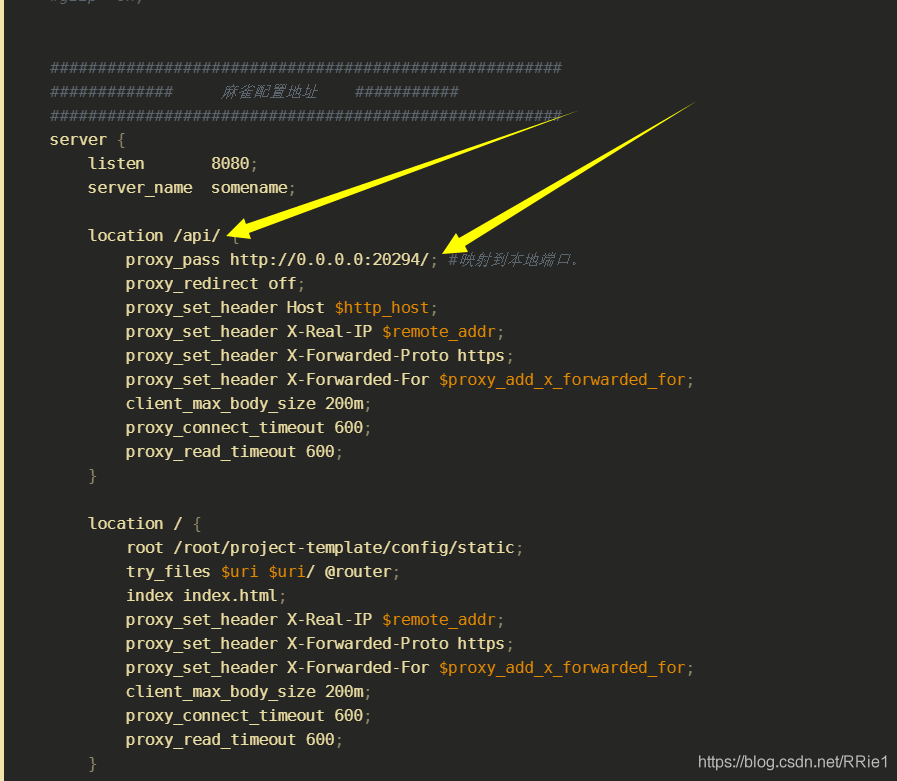
The following is my nginx configuration file:
user root;
#user  nobody;
worker_processes  4;

#error_log  logs/error.log;
#error_log  logs/error.log  notice;
#error_log  logs/error.log  info;

#pid        logs/nginx.pid;


events {
    worker_connections  1024;
}


http {
    include       mime.types;
    default_type  application/octet-stream;
    log_format main '$remote_addr - $remote_user [$time_local] "$request" '
                      '$status $body_bytes_sent "$http_referer" '
                      '"$http_user_agent" "$http_x_forwarded_for"';

    server_names_hash_bucket_size 128;
    client_header_buffer_size 32k;
    underscores_in_headers on;
    large_client_header_buffers 4 32k;
    client_max_body_size 50m;
    #log_format  main  '$remote_addr - $remote_user [$time_local] "$request" '
    #                  '$status $body_bytes_sent "$http_referer" '
    #                  '"$http_user_agent" "$http_x_forwarded_for"';

    #access_log  logs/access.log  main;

    sendfile        on;

    #keepalive_timeout  0;
    keepalive_timeout  65;
    tcp_nopush          on;
    fastcgi_connect_timeout 300;
    fastcgi_send_timeout    300;
    fastcgi_read_timeout    300;
    fastcgi_buffer_size     64k;
    fastcgi_buffers     4   64k;
    fastcgi_busy_buffers_size 128k;
    fastcgi_temp_file_write_size 256k;
    tcp_nodelay         on;

    #gzip  on;


    ######################################################
    #############     Sparrow configuration address    ###########
    ######################################################
    server {
        listen       8080;
        server_name  somename;

        location /api/ {
            proxy_pass http://0.0.0.0:20294/; #Mapping to the local port.
            proxy_redirect off;
            proxy_set_header Host $http_host;
            proxy_set_header X-Real-IP $remote_addr;
            proxy_set_header X-Forwarded-Proto https;
            proxy_set_header X-Forwarded-For $proxy_add_x_forwarded_for;
            client_max_body_size 200m;
            proxy_connect_timeout 600;
            proxy_read_timeout 600;
        }

        location/{
            root /root/project-template/config/static;
            try_files $uri $uri/ @router;
            index index.html;
            proxy_set_header X-Real-IP $remote_addr;
            proxy_set_header X-Forwarded-Proto https;
            proxy_set_header X-Forwarded-For $proxy_add_x_forwarded_for;
            client_max_body_size 200m;
            proxy_connect_timeout 600;
            proxy_read_timeout 600;
        }

        location @router {
            rewrite ^.*$ /index.html last;
        }
    }
}
note: when configuring the dynamic access API, remember to add a slash at the end
So far, the problem has been solved perfectly.
Use jstack to output the stack information in Java process to the specified file and analyze it
1. Printing stack information using jstack command
jstack -l pid >> thread.txt
Parameter: – l long lists to print out additional lock information. Jstack – L PID can be used to observe the lock holding status when a deadlock occurs
Examples
jstack -l 7052 >> thread.txt
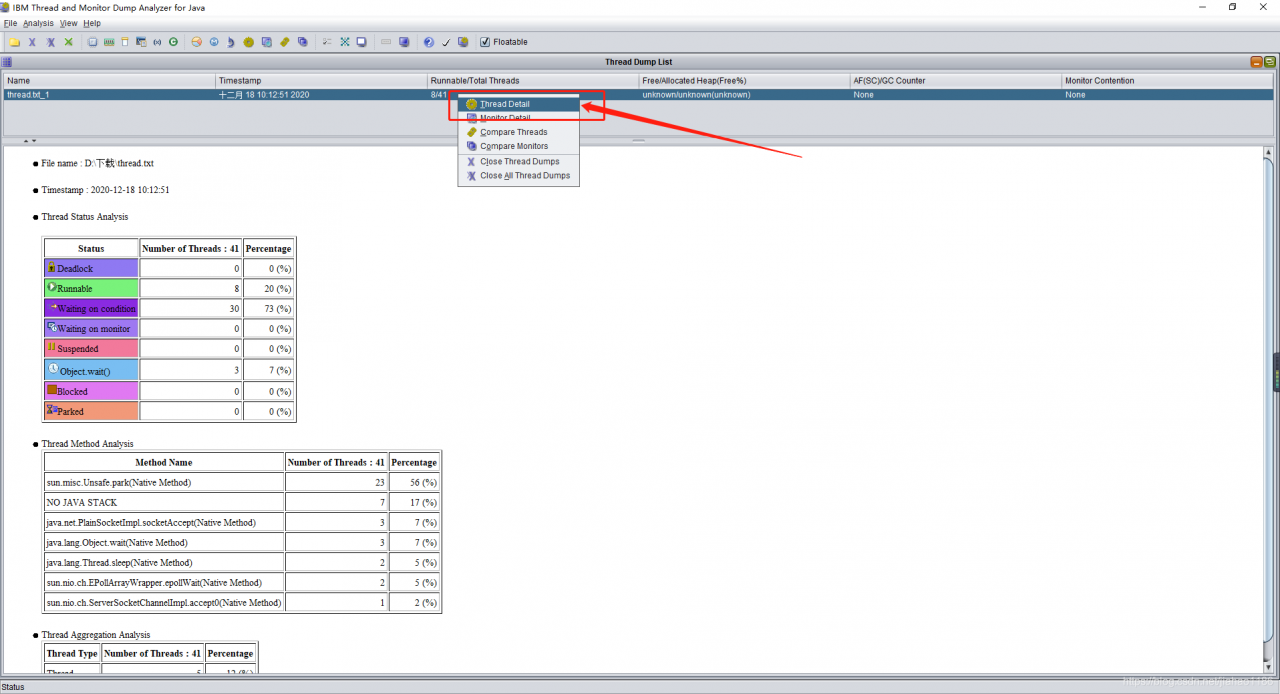
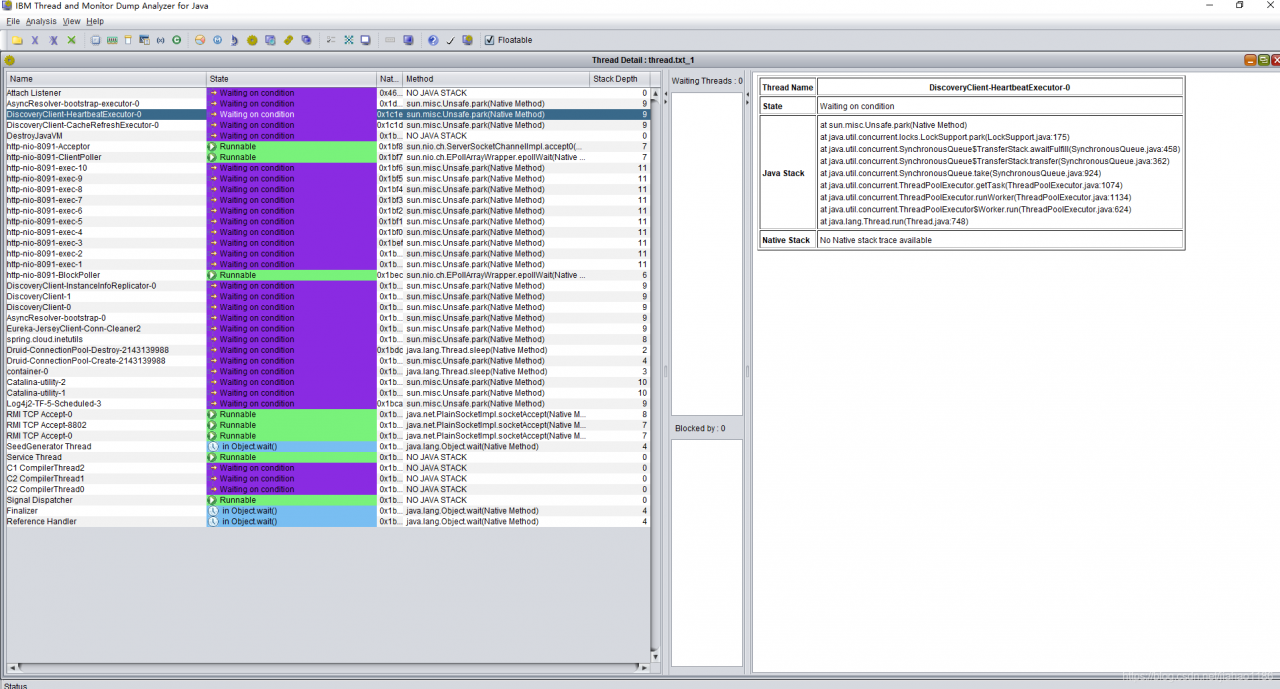
2. Analyze stack information
take thread.txt Download it locally and use IBM thread and monitor dump analyzer for Java to open the analysis
org.apache.jasper.JasperException: Unsupported encoding:
org.apache.jasper .JasperException: Unsupported encoding:
org.apache.jasper . compiler.DefaultErrorHandler.jspError ( DefaultErrorHandler.java:51 )
org.apache.jasper . compiler.ErrorDispatcher.dispatch ( ErrorDispatcher.java:409 )
org.apache.jasper . compiler.ErrorDispatcher.jspError ( ErrorDispatcher.java:116 )
org.apache.jasper . compiler.JspUtil.getReader ( JspUtil.java:1093 )
org.apache.jasper . compiler.ParserController.doParse ( ParserController.java:250 )
The reason for throwing this exception is that there is a problem in the encoding settings of the JSP page
<%@ page language=”java” import=” java.util .*” pageEncoding=””%>
Here, the value of pageencoding is empty, which cannot be recognized by the server. Even if there is one more space, the server will not recognize it.
& lt;% @ page contenttype = “text/HTML; charset = GB2312″% & gt; the charset here has an extra space, so this exception should be thrown.
Tomcat start error: severe: error listener start
Tomcat start error: severe: error listener start
problem
Today, we deal with a problem. After modifying the code and deploying it to the server, we report an error when starting Tomcat. The error message is as follows:
org.apache.catalina.core.StandardContext startInternal
SEVERE: Error listenerStart
org.apache.catalina.core.StandardContext startInternal
SEVERE: Context [/projectname] startup failed due to previous errors
error listener this error message is too vague. Check it web.xml We need more detailed log information to know what caused the error, so that we can quickly locate the error point. So we need to modify the log level of Tomcat to output what we need.
method
Create a new file called in the WEB-INF/classes directory logging.properties , as follows
handlers = org.apache.juli.FileHandler, java.util.logging.ConsoleHandler

org.apache.juli.FileHandler.level = FINE
org.apache.juli.FileHandler.directory = ${catalina.base}/logs
org.apache.juli.FileHandler.prefix = error-debug.

java.util.logging.ConsoleHandler.level = FINE
java.util.logging.ConsoleHandler.formatter=java.util.logging.SimpleFormatter
In this way, Tomcat's own log is used for log output.
After adding the log output configuration file, you can see the detailed error report after restart. After looking at the log, I found my own error, because the JDK version used by my local compilation environment is higher than that of the server. As a result, spring failed to initialize the bean, and Tomcat started with an error.
Everyone's mistakes are not the same, so I won't repeat the following mistakes.
Solution of server not running yetexception in HBase
I encountered a server not running yetexception error while working today. The symptom is that it is normal to enter HBase shell, but this error will be thrown when executing any instruction.
There is no error message when checking the log. At first I thought there was HBase process not up, but the JPS command showed that all started.
It’s a little tricky.. Because the test server was restarted a few days ago, and then I did some other work on it. So it is suspected that the problem is port occupancy.. However.. Neither..
I had no choice, so I moved out the ultimate solution: reloading Hadoop and HBase. After the official configuration is completed. HBase is miraculously good..
I once suspected that it was my configuration.. However.. Neither..
Finally found a solution on the Internet, because Hadoop is in a safe mode. So HBase operation will be abnormal. I’m not sure how it works. The solution is to manually exit safe mode
./hadoop dfsadmin -safemode leave Then restart HBase and solve the problem
appear org.springframework.beans . factory.BeanCreationException Causes and solutions of abnormal
1 Abnormal description
After checking out the project from SVN and configuring it, start the Tomcat server and report the following error:
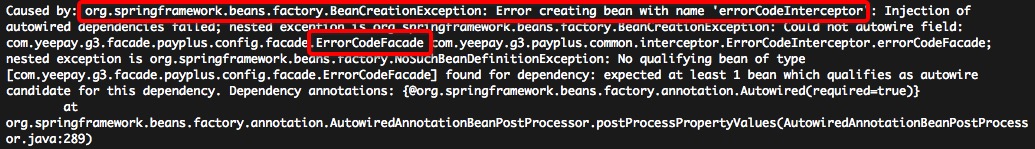
2 Abnormal Causes
By observing the abnormal information marked in the figure above, we can know
Org. Springframework. Beans. Factory. BeanCreationException: Error creating bean with the name ‘XXX’
This exception is: Injection bean failed exception.
To put it bluntly, if this exception occurs, the corresponding bean cannot be found! The reasons why bean injection can fail include but are not limited to the following:
The corresponding bean is not annotated; @service stead of dubbo; Select the wrong automatic injection method, etc.
3 Solutions
Now that we know the cause of this exception, we look back at the corresponding Bean declaration and see that the code that injected the Facade is:
@Autowired
ErrorCodeFacade errorCodeFacade;
Well, here’s the mistake! In general, when injecting interfaces at the Service and Biz layer, you can use @Autowiredfor example:
@Autowired
ErrorCodeService errorCodeService;
But, when injected into the Facade layer interface, should use the RemoteServiceFactory. GetService () , such as:
ErrorCodeFacade errorCodeFacade = RemoteServiceFactory.getService(ErrorCodeFacade.class);
That is, the exception is resolved by declaring the ErrorCodeFacade with the code above.
Warm prompt: there are many reasons for this exception, the above only lists the problems I encountered and solutions, I hope to be helpful to you!