Tag Archives: doris

[Solved] The main method caused an error: Could not deploy Yarn job cluster.

org.apache.flink.client.program.ProgramInvocationException: The main method caused an error: Could not deploy Yarn job cluster.

Caused by: org.apache.flink.client.deployment.ClusterDeploymentException: Could not deploy Yarn job cluster.

Caused by: org.apache.flink.yarn.YarnClusterDescriptor$YarnDeploymentException: The YARN application unexpectedly switched to state FAILED during deployment.

Diagnostics from YARN: Application application_1640140324841_0003 failed 1 times (global limit =4; local limit is =1) due to AM Container for appattempt_1640140324841_0003_000001 exited with  exitCode: 1
Failing this attempt.Diagnostics: [2021-12-22 11:23:34.422]Exception from container-launch.
Container id: container_e44_1640140324841_0003_01_000001
Exit code: 1
Shell output: main : command provided 1
main : run as user is etl_admin
main : requested yarn user is etl_admin
Getting exit code file…
Creating script paths…
Writing pid file…
Writing to tmp file /data1/yarn/nm/nmPrivate/application_1640140324841_0003/container_e44_1640140324841_0003_01_000001/container_e44_1640140324841_0003_01_000001.pid.tmp
Writing to cgroup task files…
Creating local dirs…
Launching container…


Solution:
Look is the flink version of the idea is 1.11.0, the flink version on the cluster is 1.13.1
Directly upgrade the flink version in the idea to 1.13.1, done!

Doris reports an error: error 1064 (HY000) [How to Solve]

1、Failed to get scan range, no queryable replica found in tablet
Error Message:
ERROR 1064 (HY000): errCode = 2, detailMessage = Failed to get scan range, no queryable replica found in tablet: 11018

MySQL [tpa]> select * from tpa.table1;
ERROR 1064 (HY000): errCode = 2, detailMessage = Failed to get scan range, no queryable replica found in tablet: 11018
MySQL [tpa]>

(1) Check the be cluster information and no problems are found

MySQL [tpa]> show backends \G
*************************** 1. row ***************************
BackendId: 11002
Cluster: default_cluster
IP: 10.17.12.158
HeartbeatPort: 9050
BePort: 9060
HttpPort: 8040
BrpcPort: 8060
LastStartTime: 2021-08-13 09:46:23
LastHeartbeat: 2021-08-25 16:35:22
Alive: true
SystemDecommissioned: false
ClusterDecommissioned: false
TabletNum: 11
DataUsedCapacity: 2.389 KB
AvailCapacity: 2.273 GB
TotalCapacity: 49.090 GB
UsedPct: 95.37 %
MaxDiskUsedPct: 95.37 %
ErrMsg:
Version: 0.14.7-Unknown
Status: {"lastSuccessReportTabletsTime":"2021-08-25 16:34:55"}
*************************** 2. row ***************************
BackendId: 11001
Cluster: default_cluster
IP: 10.17.12.159
HeartbeatPort: 9050
BePort: 9060
HttpPort: 8040
BrpcPort: 8060
LastStartTime: 2021-08-13 09:41:46
LastHeartbeat: 2021-08-25 16:35:22
Alive: true
SystemDecommissioned: false
ClusterDecommissioned: false
TabletNum: 15
DataUsedCapacity: 1.542 KB
AvailCapacity: 12.090 GB
TotalCapacity: 49.090 GB
UsedPct: 75.37 %
MaxDiskUsedPct: 75.37 %
ErrMsg:
Version: 0.14.7-Unknown
Status: {"lastSuccessReportTabletsTime":"2021-08-25 16:34:41"}
*************************** 3. row ***************************
BackendId: 10002
Cluster: default_cluster
IP: 10.17.12.160
HeartbeatPort: 9050
BePort: 9060
HttpPort: 8040
BrpcPort: 8060
LastStartTime: 2021-08-25 15:57:11
LastHeartbeat: 2021-08-25 16:35:22
Alive: true
SystemDecommissioned: false
ClusterDecommissioned: false
TabletNum: 10
DataUsedCapacity: 3.084 KB
AvailCapacity: 1.902 GB
TotalCapacity: 49.090 GB
UsedPct: 96.13 %
MaxDiskUsedPct: 96.13 %
ErrMsg:
Version: 0.14.7-Unknown
Status: {"lastSuccessReportTabletsTime":"2021-08-25 16:35:13"}
3 rows in set (0.00 sec)

MySQL [tpa]>

(2) Error in select query command

MySQL [tpa]>desc table1;
+----------+-------------+------+-------+---------+-------+
| Field | Type | Null | Key | Default | Extra |
+----------+-------------+------+-------+---------+-------+
| siteid | INT | Yes | true | 10 | |
| citycode | SMALLINT | Yes | true | NULL | |
| username | VARCHAR(32) | Yes | true | | |
| pv | BIGINT | Yes | false | 0 | SUM |
+----------+-------------+------+-------+---------+-------+
4 rows in set (0.00 sec)

MySQL [tpa]> select * from tpa.table1;
ERROR 1064 (HY000): errCode = 2, detailMessage = Failed to get scan range, no queryable replica found in tablet: 11018
MySQL [tpa]> select count(1) from table1 ;
ERROR 1064 (HY000): errCode = 2, detailMessage = Failed to get scan range, no queryable replica found in tablet: 11018
MySQL [tpa]>

2. Problem analysis and solution

(1) Problem analysis
in the first step, baidu received an error message and couldn’t find the corresponding error message. Didn’t everyone encounter the same error
in the second step, you can’t find a solution online, so you have to analyze it yourself. My English is very poor, but I can roughly guess that no queryable replica found in tablet roughly means that the corresponding queryable replica cannot be found in tablet. There may be a problem with the copy
the third step is to look up the replica information. I build the table according to the official document. The number of replicas is set to 1. The problem is that it is possible.

CREATE TABLE table1
(
    siteid INT DEFAULT '10',
    citycode SMALLINT,
    username VARCHAR(32) DEFAULT '',
    pv BIGINT SUM DEFAULT '0'
)
AGGREGATE KEY(siteid, citycode, username)
DISTRIBUTED BY HASH(siteid) BUCKETS 10
PROPERTIES("replication_num" = "1");

(2) Verify the conjecture
the first step is to create a table with 2 copies

MySQL [tpa]> CREATE TABLE t1
    -> (
    ->     siteid INT DEFAULT '10',
    ->     citycode SMALLINT,
    ->     username VARCHAR(32) DEFAULT '',
    ->     pv BIGINT SUM DEFAULT '0'
    -> )
    -> AGGREGATE KEY(siteid, citycode, username)
    -> DISTRIBUTED BY HASH(siteid) BUCKETS 10
    -> PROPERTIES("replication_num" = "2");
Query OK, 0 rows affected (1.20 sec)

MySQL [tpa]> exit
Bye

Step 2: import data

[root@node3 ~]# curl --location-trusted -u test:test -H "label:t1_20170707" -H "column_separator:," -T table1_data http://node3:8030/api/tpa/t1/_stream_load
{
    "TxnId": 428829,
    "Label": "t1_20170707",
    "Status": "Success",
    "Message": "OK",
    "NumberTotalRows": 5,
    "NumberLoadedRows": 5,
    "NumberFilteredRows": 0,
    "NumberUnselectedRows": 0,
    "LoadBytes": 55,
    "LoadTimeMs": 840,
    "BeginTxnTimeMs": 1,
    "StreamLoadPutTimeMs": 12,
    "ReadDataTimeMs": 0,
    "WriteDataTimeMs": 710,
    "CommitAndPublishTimeMs": 116
}

Step 3: execute the query and everything is normal.

[root@node3 ~]# mysql -h 10.17.12.160 -P 9030 -uroot -p123456
Welcome to the MariaDB monitor.  Commands end with ; or \g.
Your MySQL connection id is 23
Server version: 5.1.0 Baidu Doris version 0.14.7-Unknown

Copyright (c) 2000, 2016, Oracle, MariaDB Corporation Ab and others.

Type 'help;' or '\h' for help. Type '\c' to clear the current input statement.

MySQL [(none)]> use tpa;
Reading table information for completion of table and column names
You can turn off this feature to get a quicker startup with -A

Database changed
MySQL [tpa]> select count(1) from t1;
+----------+
| count(1) |
+----------+
|        5 |
+----------+
1 row in set (1.01 sec)

MySQL [tpa]> 

Preliminary conclusion: it may be due to the problem of the number of copies when creating the table, which needs further verification in the future

Doris BrokerLoad Error: quality not good enough to cancel

Brokerload statement

LOAD
LABEL gaofeng_broker_load_HDD
(
    DATA INFILE("hdfs://eoop/user/coue_data/hive_db/couta_test/ader_lal_offline_0813_1/*")
    INTO TABLE ads_user
)
    WITH BROKER "hdfs_broker"
(
    "dfs.nameservices"="eadhadoop",
    "dfs.ha.namenodes.eadhadoop" = "nn1,nn2",
    "dfs.namenode.rpc-address.eadhadoop.nn1" = "h4:8000",
    "dfs.namenode.rpc-address.eadhadoop.nn2" = "z7:8000",
    "dfs.client.failover.proxy.provider.eadhadoop" = "org.apache.hadoop.hdfs.server.namenode.ha.ConfiguredFailoverProxyProvider",
    "hadoop.security.authentication" = "kerberos","kerberos_principal" = "ou3.CN",
    "kerberos_keytab_content" = "BQ8uMTYzLkNPTQALY291cnNlXgAAAAFfVyLbAQABAAgCtp0qmxxP8QAAAAE="
);

report errors

Task cancelled

type:ETL_ QUALITY_ UNSATISFIED; msg:quality not good enough to cancel


Solution:

Generally, there must be a deeper reason for this error
you can see the URL field of the brokerload task through show load

show load warnings on ‘{URL}’
or open the web page directly

the number of fields is inconsistent or other reasons. The fundamental reason
is that the number of fields in some rows in the file to be imported is inconsistent with that in the table, Or the size of a field in some lines of the file exceeds the upper limit of the corresponding table field, resulting in data quality problems, which need to be adjusted accordingly

If you wants to ignore these error data
modify the task statement configuration parameter “Max_ filter_ratio” = “1”

LOAD
LABEL gaofeng_broker_load_HDD
(
    DATA INFILE("hdfs://eoop/user/coue_data/hive_db/couta_test/ader_lal_offline_0813_1/*")
    INTO TABLE ads_user
)
    WITH BROKER "hdfs_broker"
(
    "dfs.nameservices"="eadhadoop",
    "dfs.ha.namenodes.eadhadoop" = "nn1,nn2",
    "dfs.namenode.rpc-address.eadhadoop.nn1" = "h4:8000",
    "dfs.namenode.rpc-address.eadhadoop.nn2" = "z7:8000",
    "dfs.client.failover.proxy.provider.eadhadoop" = "org.apache.hadoop.hdfs.server.namenode.ha.ConfiguredFailoverProxyProvider",
    "hadoop.security.authentication" = "kerberos","kerberos_principal" = "ou3.CN",
    "kerberos_keytab_content" = "BQ8uMTYzLkNPTQALY291cnNlXgAAAAFfVyLbAQABAAgCtp0qmxxP8QAAAAE="
)
PROPERTIES
(
    "max_filter_ratio" = "1"
);

Doris BrokerLoad Error: No source file in this table [How to Solve]

Brokerload statement

LOAD
LABEL gaofeng_broker_load_HDD
(
    DATA INFILE("hdfs://eoop/user/coue_data/hive_db/couta_test/ader_lal_offline_0813_1")
    INTO TABLE ads_user
)
    WITH BROKER "hdfs_broker"
(
    "dfs.nameservices"="eadhadoop",
    "dfs.ha.namenodes.eadhadoop" = "nn1,nn2",
    "dfs.namenode.rpc-address.eadhadoop.nn1" = "h4:8000",
    "dfs.namenode.rpc-address.eadhadoop.nn2" = "z7:8000",
    "dfs.client.failover.proxy.provider.eadhadoop" = "org.apache.hadoop.hdfs.server.namenode.ha.ConfiguredFailoverProxyProvider",
    "hadoop.security.authentication" = "kerberos","kerberos_principal" = "ou3.CN",
    "kerberos_keytab_content" = "BQ8uMTYzLkNPTQALY291cnNlXgAAAAFfVyLbAQABAAgCtp0qmxxP8QAAAAE="
);

report errors

Task cancelled

type:ETL_ RUN_ FAIL; msg:errCode = 2, detailMessage = No source file in this table(ads_ user).

Solution:

The data file path in the broker load statement is written incorrectly. What needs to be written is a file, not a directory
this directory is the directory I export the table directly. This cannot be used in broker load, but many files below
will be
hdfs://eoop/user/coue_ data/hive_ db/couta_ test/ader_ lal_ offline_ 0813_ 1

Modify to
hdfs://eoop/user/coue_ data/hive_ db/couta_ test/ader_ lal_ offline_ 0813_ 1/*

that will do

[Solved] Doris BrokerLoad Error: Scan bytes per broker scanner exceed limit: 3221225472

Brokerload statement

LOAD
LABEL gaofeng_broker_load_HDD
(
    DATA INFILE("hdfs://eoop/user/coue_data/hive_db/couta_test/ader_lal_offline_0813_1/*")
    INTO TABLE ads_user
)
    WITH BROKER "hdfs_broker"
(
    "dfs.nameservices"="eadhadoop",
    "dfs.ha.namenodes.eadhadoop" = "nn1,nn2",
    "dfs.namenode.rpc-address.eadhadoop.nn1" = "h4:8000",
    "dfs.namenode.rpc-address.eadhadoop.nn2" = "z7:8000",
    "dfs.client.failover.proxy.provider.eadhadoop" = "org.apache.hadoop.hdfs.server.namenode.ha.ConfiguredFailoverProxyProvider",
    "hadoop.security.authentication" = "kerberos","kerberos_principal" = "ou3.CN",
    "kerberos_keytab_content" = "BQ8uMTYzLkNPTQALY291cnNlXgAAAAFfVyLbAQABAAgCtp0qmxxP8QAAAAE="
);

report errors

Task cancelled

type:ETL_ RUN_ FAIL; msg:errCode = 2, detailMessage = Scan bytes per broker scanner exceed limit: 3221225472


Solution:

The Doris test environment consists of three be nodes, while the Fe configuration is max_bytes_per_broker_Scanner defaults to 3G, and the files to be imported are about 13gb
parameters need to be modified
Fe executes the following dynamic parameter modification command
admin set frontend config ("Max_ bytes_ per_ broker_ scanner" = "5368709120");
is modified to 5g. In this way, the maximum file size that can be imported by the cluster is 5g * 3 (be) = 15GB
execute it again

Doris BrokerLoad Error: quality not good enough to cancel

Brokerload statement

LOAD
LABEL gaofeng_broker_load_HDD
(
    DATA INFILE("hdfs://eoop/user/coue_data/hive_db/couta_test/ader_lal_offline_0813_1/*")
    INTO TABLE ads_user
)
    WITH BROKER "hdfs_broker"
(
    "dfs.nameservices"="eadhadoop",
    "dfs.ha.namenodes.eadhadoop" = "nn1,nn2",
    "dfs.namenode.rpc-address.eadhadoop.nn1" = "h4:8000",
    "dfs.namenode.rpc-address.eadhadoop.nn2" = "z7:8000",
    "dfs.client.failover.proxy.provider.eadhadoop" = "org.apache.hadoop.hdfs.server.namenode.ha.ConfiguredFailoverProxyProvider",
    "hadoop.security.authentication" = "kerberos","kerberos_principal" = "ou3.CN",
    "kerberos_keytab_content" = "BQ8uMTYzLkNPTQALY291cnNlXgAAAAFfVyLbAQABAAgCtp0qmxxP8QAAAAE="
);

report errors

Task cancelled

type:ETL_ QUALITY_ UNSATISFIED; msg:quality not good enough to cancel


Solution:

Generally, there must be a deeper reason for this error
you can see the URL field of the brokerload task through show load

show load warnings on ‘{URL}’
or open the web page directly

the number of fields is inconsistent or other reasons. The fundamental reason
is that the number of fields in some rows in the file to be imported is inconsistent with that in the table, Or the size of a field in some lines of the file exceeds the upper limit of the corresponding table field, resulting in data quality problems, which need to be adjusted accordingly

If  wants to ignore these error data
modify the task statement configuration parameter “Max”_ filter_ ratio” = “1”

LOAD
LABEL gaofeng_broker_load_HDD
(
    DATA INFILE("hdfs://eoop/user/coue_data/hive_db/couta_test/ader_lal_offline_0813_1/*")
    INTO TABLE ads_user
)
    WITH BROKER "hdfs_broker"
(
    "dfs.nameservices"="eadhadoop",
    "dfs.ha.namenodes.eadhadoop" = "nn1,nn2",
    "dfs.namenode.rpc-address.eadhadoop.nn1" = "h4:8000",
    "dfs.namenode.rpc-address.eadhadoop.nn2" = "z7:8000",
    "dfs.client.failover.proxy.provider.eadhadoop" = "org.apache.hadoop.hdfs.server.namenode.ha.ConfiguredFailoverProxyProvider",
    "hadoop.security.authentication" = "kerberos","kerberos_principal" = "ou3.CN",
    "kerberos_keytab_content" = "BQ8uMTYzLkNPTQALY291cnNlXgAAAAFfVyLbAQABAAgCtp0qmxxP8QAAAAE="
)
PROPERTIES
(
    "max_filter_ratio" = "1"
);

[Solved] Fe node hangs up and restarts with an error sleepycat.je.locktimeoutexception: (JE 7.3.7) lock expired

Error Message:
replay journal cost too much time: 1001 replayedJournalId: 462527012021-06-25 00:00:44,846 WARN (replayer|70) [BDBJournalCursor.next():149] Catch an exception when get next JournalEntity. key:46252706com.sleepycat.je.LockTimeoutException: (JE 7.3.7) Lock expired. Locker 1009050036 -1_replayer_ReplicaThreadLocker: waited for lock on database=46236602 LockAddr:1984482862 LSN=0x858/0x3c1ac4 type=READ grant=WAIT_NEW timeoutMillis=1000 startTime=1624550443846 endTime=1624550444846Owners: [<LockInfo locker="<ReplayTxn id="-48657952">970177120 -48657952_ReplayThread_ReplayTxn" type="WRITE"/>]Waiters: [<LockInfo locker="1009050036 -1_replayer_ReplicaThreadLocker" type="READ"/>]
There is a test service in the fe node bdb log error caused the fe hang, and then start can not start up, look at the doris-meta/bdb/under je.info.0 log found last night there is this error report
2021-06-24 16:00:47.926 UTC SEVERE [10.1.1.1_9010_1623157894289] 10.1.1.1_9010_1623157894289(4):/disk1/doris/doris-meta/bdb:DataCorruptionVerifier exited unexpectedly with exception java.io.IOException: Input/output errorjava.io.IOException: Input/output error
The inference is that there is a problem with the disk
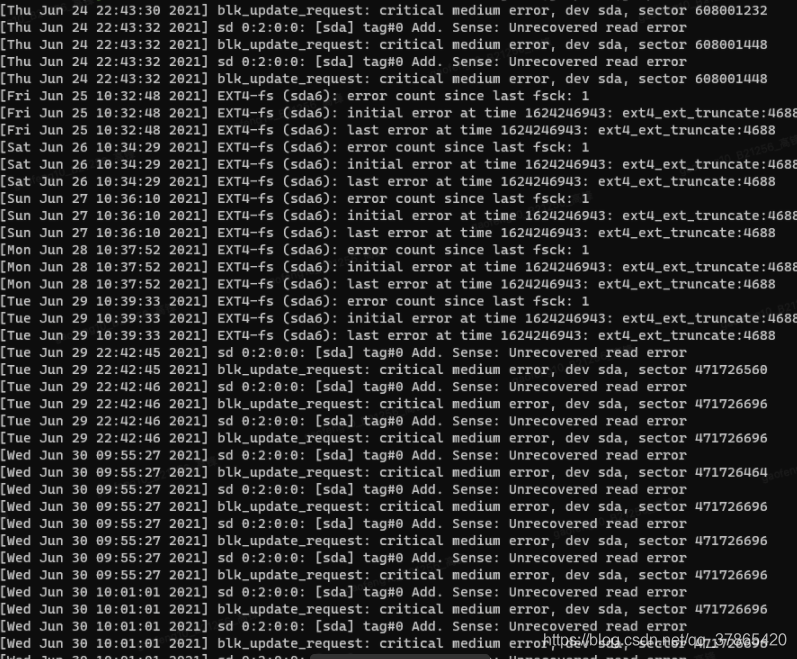
dmesg -T | grep sda| grep error | tail -40

There is indeed a problem with the sector, you need to contact the IDC

Doris streamload task reported an error connection reset [How to Solve]

Background

The spark program scans a hive table (size 3-7g), and then submits the streamload task of HTTP protocol to the Doris cluster. After the Doris cluster is upgraded from 0.13.15 to 0.14.12, the Spark Program suddenly reports an error streamload, and a connection reset occurs

analysis

enable_ http_ server_ V2
this parameter can be viewed by referring to the Fe Chinese configuration. It is used to determine whether to open a new style interface for the Doris interface, but in fact it has more than that. Please continue

New and old versions for Enable_ http_ server_ The default value of V2 parameter is different

In 0.13.15, the default value is false, that is, the default interface is the style of the old version, and the UI is older.

0.14.12 on the contrary, the default value is true, that is, the default interface opens a new style and new UI interface, but there will be problems at the same time
according to the analysis of the source code (palofe. Java), HTTP V2 does not limit the file size uploaded by HTTP, so the default value in springboot will be used to limit it, and the problem of connection reset will appear in the appearance.

Solution:

Method 1: close this parameter and the task can run normally

Method 2: I originally wanted to fix this problem. After looking at the community, I found that a doris-6013 was just merged two days ago, which is exactly the problem. I need to make a patch. However, note that there is a problem with this PR, and the unit is wrong. I need to make a patch together with doris-6070 to fix it.
these two PR mainly add two parameters to httpv2 in the new version of Doris

spring.servlet.multipart.max-file-size=100M
spring.servlet.multipart.max-request-size=100MB
max-file-size is the individual file size
max-request-size is to set the total uploaded data size

If you want to not limit the size of file upload, set both values to – 1. I didn’t test this – 1, but it should work. I will comment on this blog after I test it or confirm with the proposer of PR

Key supplement

After testing, it is found that the above two parameters have no effect. Refer to the community issue-6149
this patch to fix this problem

Doris Error: there is no scanNode Backend [How to Solve]

Background

No. 3.8 on the business development side responded that sparkstreaming lost, scanned the Doris table (query SQL) and reported an error

Caused by: org.apache.spark.SparkException: Job aborted due to stage failure: Task 7 in stage 0.0 failed 4 times, most recent failure: Lost task 7.3 in stage 0.0 (TID 20, hd012.corp.yodao.com, executor 7): com.mysql.jdbc.exceptions.jdbc4.MySQLSyntaxErrorException: errCode = 2, 
detailMessage = there is no scanNode Backend. [126101: in black list(Ocurrs time out with specfied time 10000 MICROSECONDS), 14587381: in black list(Ocurrs time out with specfied time 10000 MICROSECONDS), 213814: in black list(Ocurrs time out with specfied time 10000 MICROSECONDS)]

Error:
detailMessage = there is no scanNode Backend. [126101: in black list(Ocurrs time out with specfied time 10000 MICROSECONDS), 14587381: in black list(Ocurrs time out with specfied time 10000 MICROSECONDS), 213814: in black list(Ocurrs time out with specfied time 10000 MICROSECONDS)]
Source Code Analysis

//Blacklisted objects
private static Map<Long, Pair<Integer, String>> blacklistBackends = Maps.newConcurrentMap();

//The task execution process requires getHost, and the return value is the TNetworkAddress object
public static TNetworkAddress getHost(long backendId,
                                      List<TScanRangeLocation> locations,
                                      ImmutableMap<Long, Backend> backends,
                                      Reference<Long> backendIdRef)

//Get the backend object by backendId in the getHost() method
Backend backend = backends.get(backendId);


// determine if the backend object is available
//return the TNetworkAddress object if it is available
//If it's not available, it iterate through the locations object to find a candidate backend object
//If the backend just unavailable is the same as the candidate backend object id, then continue
//If not, determine whether it is available, available then return to change the candidate be's TNetworkAddress
//If not available, continue to change the next candidate be


if (isAvailable(backend)) {
    backendIdRef.setRef(backendId);
    return new TNetworkAddress(backend.getHost(), backend.getBePort());
}  else {
    for (TScanRangeLocation location : locations) {
        if (location.backend_id == backendId) {
            continue;
        }
        // choose the first alive backend(in analysis stage, the locations are random)
        Backend candidateBackend = backends.get(location.backend_id);
        if (isAvailable(candidateBackend)) {
            backendIdRef.setRef(location.backend_id);
            return new TNetworkAddress(candidateBackend.getHost(), candidateBackend.getBePort());
        }
    }
}

public static boolean isAvailable(Backend backend) {
    return (backend != null && backend.isAlive() && !blacklistBackends.containsKey(backend.getId()));
}


//If a be is not returned until the end, the cause of the exception is returned
// no backend returned
throw new UserException("there is no scanNode Backend. " +
        getBackendErrorMsg(locations.stream().map(l -> l.backend_id).collect(Collectors.toList()),
                backends, locations.size()));


// get the reason why backends can not be chosen.
private static String getBackendErrorMsg(List<Long> backendIds, ImmutableMap<Long, Backend> backends, int limit) {
    List<String> res = Lists.newArrayList();
    for (int i = 0; i < backendIds.size() && i < limit; i++) {
        long beId = backendIds.get(i);
        Backend be = backends.get(beId);
        if (be == null) {
            res.add(beId + ": not exist");
        } else if (!be.isAlive()) {
            res.add(beId + ": not alive");
        } else if (blacklistBackends.containsKey(beId)) {
            Pair<Integer, String> pair = blacklistBackends.get(beId);
            res.add(beId + ": in black list(" + (pair == null ?"unknown" : pair.second) + ")");
        } else {
            res.add(beId + ": unknown");
        }
    }
    return res.toString();
}


//blacklistBackends object's put
public static void addToBlacklist(Long backendID, String reason) {
    if (backendID == null) {
        return;
    }

    blacklistBackends.put(backendID, Pair.create(FeConstants.heartbeat_interval_second + 1, reason));
    LOG.warn("add backend {} to black list. reason: {}", backendID, reason);
}


public static void addToBlacklist(Long backendID, String reason) {
    if (backendID == null) {
        return;
    }

    blacklistBackends.put(backendID, Pair.create(FeConstants.heartbeat_interval_second + 1, reason));
    LOG.warn("add backend {} to black list. reason: {}", backendID, reason);
}

Cause analysis

According to the task error
detailmessage = there is no scannode backend. [126101: in black list (ocurrs time out with specified time 10000 microseconds), 14587381: in black list (ocurrs time out with specified time 10000 microseconds), 213814: in black list (ocurrs time out with specified time 10000 microseconds)]
analysis, be ID is 126101 The reason why nodes 14587381 and 213814 are in the blacklist may be that ocurrs time out with specified time 10000 microseconds
then it is likely that the three bes on March 8 hung up at that time
according to point 7 of the previous experience of community students
it can be inferred that the be hung up because of improper tasks or configurations

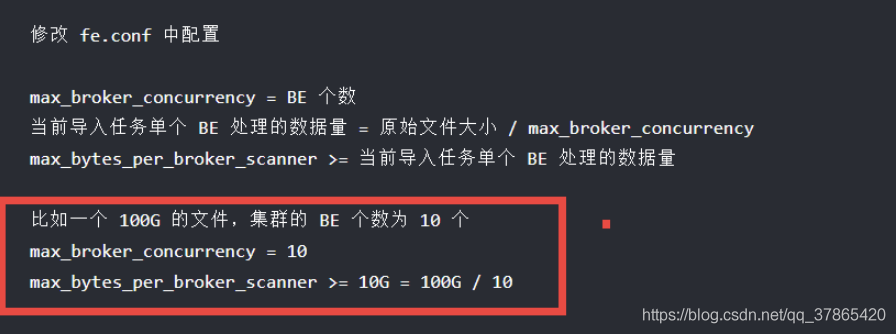
Broker or other tasks overwhelm the be service_ broker_ concurrencymax_ bytes_ per_ broker_ scanner
The specific error was reported because the problem occurred on March 8. Today, more than 20 days have passed. During this period, it has experienced Doris cluster expansion, node rearrangement and other operation and maintenance work. Logs and many backups cannot be recovered. It can only be inferred from ocurrs time out with specified time 10000 microseconds that the be may have hung up at that time, Then our services will be mounted on the supervisor, so they will start automatically (the node service is not available before) ‘s Prometheus rules & amp; Alertmanager alarm)
if the same problem occurs again in the future, continue to improve this article

Solutions

Prometheus rules & amp; amp; amp; amp; nbsp; with be node service unavailable ; Alertmanager alarm
adjust the configuration in fe.conf
configure the spark task and broker task during execution
there is no substantive solution for the time being. If the problem reappears, continue to track and supplement solutions

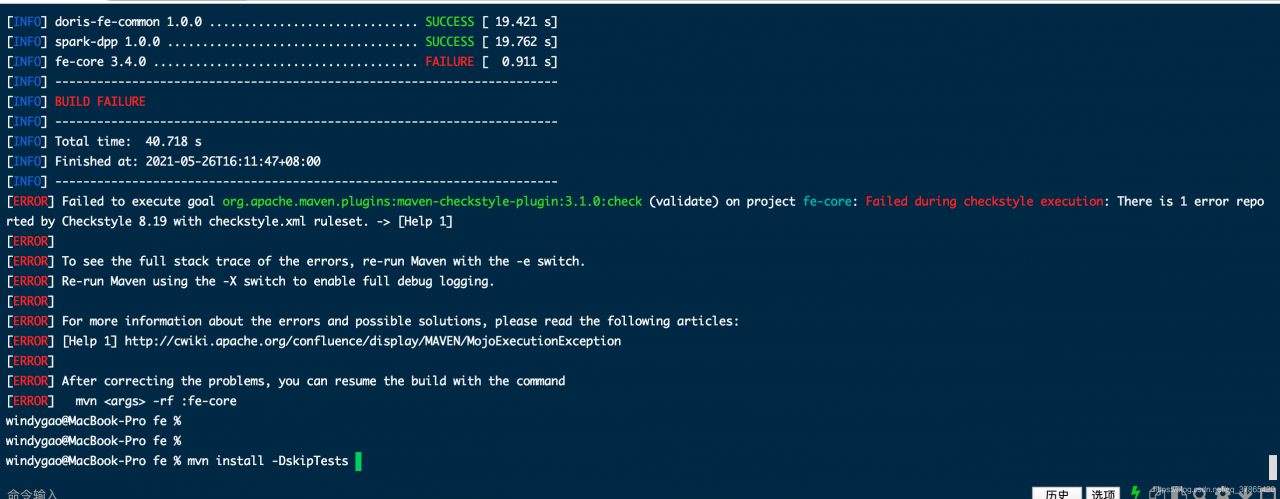
Mac compiles Doris with MVN and reports an error checkstyle

Interpreter

Error while checkstyle execution

debug

mvn install -DskipTests -X

[INFO] ------------------------------------------------------------------------
[INFO] Reactor Summary:
[INFO] 
[INFO] doris-fe 3.4.0 ..................................... SUCCESS [  0.383 s]
[INFO] doris-fe-common 1.0.0 .............................. SUCCESS [ 23.695 s]
[INFO] spark-dpp 1.0.0 .................................... SUCCESS [ 15.984 s]
[INFO] fe-core 3.4.0 ...................................... FAILURE [  0.949 s]
[INFO] ------------------------------------------------------------------------
[INFO] BUILD FAILURE
[INFO] ------------------------------------------------------------------------
[INFO] Total time:  41.420 s
[INFO] Finished at: 2021-05-26T16:23:43+08:00
[INFO] ------------------------------------------------------------------------
[ERROR] Failed to execute goal org.apache.maven.plugins:maven-checkstyle-plugin:3.1.0:check (validate) on project fe-core: Failed during checkstyle execution: There is 1 error reported by Checkstyle 8.19 with checkstyle.xml ruleset. -> [Help 1]
org.apache.maven.lifecycle.LifecycleExecutionException: Failed to execute goal org.apache.maven.plugins:maven-checkstyle-plugin:3.1.0:check (validate) on project fe-core: Failed during checkstyle execution
    at org.apache.maven.lifecycle.internal.MojoExecutor.execute (MojoExecutor.java:215)
    at org.apache.maven.lifecycle.internal.MojoExecutor.execute (MojoExecutor.java:156)
    at org.apache.maven.lifecycle.internal.MojoExecutor.execute (MojoExecutor.java:148)
    at org.apache.maven.lifecycle.internal.LifecycleModuleBuilder.buildProject (LifecycleModuleBuilder.java:117)
    at org.apache.maven.lifecycle.internal.LifecycleModuleBuilder.buildProject (LifecycleModuleBuilder.java:81)
    at org.apache.maven.lifecycle.internal.builder.singlethreaded.SingleThreadedBuilder.build (SingleThreadedBuilder.java:56)
    at org.apache.maven.lifecycle.internal.LifecycleStarter.execute (LifecycleStarter.java:128)
    at org.apache.maven.DefaultMaven.doExecute (DefaultMaven.java:305)
    at org.apache.maven.DefaultMaven.doExecute (DefaultMaven.java:192)
    at org.apache.maven.DefaultMaven.execute (DefaultMaven.java:105)
    at org.apache.maven.cli.MavenCli.execute (MavenCli.java:957)
    at org.apache.maven.cli.MavenCli.doMain (MavenCli.java:289)
    at org.apache.maven.cli.MavenCli.main (MavenCli.java:193)
    at sun.reflect.NativeMethodAccessorImpl.invoke0 (Native Method)
    at sun.reflect.NativeMethodAccessorImpl.invoke (NativeMethodAccessorImpl.java:62)
    at sun.reflect.DelegatingMethodAccessorImpl.invoke (DelegatingMethodAccessorImpl.java:43)
    at java.lang.reflect.Method.invoke (Method.java:498)
    at org.codehaus.plexus.classworlds.launcher.Launcher.launchEnhanced (Launcher.java:282)
    at org.codehaus.plexus.classworlds.launcher.Launcher.launch (Launcher.java:225)
    at org.codehaus.plexus.classworlds.launcher.Launcher.mainWithExitCode (Launcher.java:406)
    at org.codehaus.plexus.classworlds.launcher.Launcher.main (Launcher.java:347)
Caused by: org.apache.maven.plugin.MojoExecutionException: Failed during checkstyle execution
    at org.apache.maven.plugins.checkstyle.CheckstyleViolationCheckMojo.execute (CheckstyleViolationCheckMojo.java:546)
    at org.apache.maven.plugin.DefaultBuildPluginManager.executeMojo (DefaultBuildPluginManager.java:137)
    at org.apache.maven.lifecycle.internal.MojoExecutor.execute (MojoExecutor.java:210)
    at org.apache.maven.lifecycle.internal.MojoExecutor.execute (MojoExecutor.java:156)
    at org.apache.maven.lifecycle.internal.MojoExecutor.execute (MojoExecutor.java:148)
    at org.apache.maven.lifecycle.internal.LifecycleModuleBuilder.buildProject (LifecycleModuleBuilder.java:117)
    at org.apache.maven.lifecycle.internal.LifecycleModuleBuilder.buildProject (LifecycleModuleBuilder.java:81)
    at org.apache.maven.lifecycle.internal.builder.singlethreaded.SingleThreadedBuilder.build (SingleThreadedBuilder.java:56)
    at org.apache.maven.lifecycle.internal.LifecycleStarter.execute (LifecycleStarter.java:128)
    at org.apache.maven.DefaultMaven.doExecute (DefaultMaven.java:305)
    at org.apache.maven.DefaultMaven.doExecute (DefaultMaven.java:192)
    at org.apache.maven.DefaultMaven.execute (DefaultMaven.java:105)
    at org.apache.maven.cli.MavenCli.execute (MavenCli.java:957)
    at org.apache.maven.cli.MavenCli.doMain (MavenCli.java:289)
    at org.apache.maven.cli.MavenCli.main (MavenCli.java:193)
    at sun.reflect.NativeMethodAccessorImpl.invoke0 (Native Method)
    at sun.reflect.NativeMethodAccessorImpl.invoke (NativeMethodAccessorImpl.java:62)
    at sun.reflect.DelegatingMethodAccessorImpl.invoke (DelegatingMethodAccessorImpl.java:43)
    at java.lang.reflect.Method.invoke (Method.java:498)
    at org.codehaus.plexus.classworlds.launcher.Launcher.launchEnhanced (Launcher.java:282)
    at org.codehaus.plexus.classworlds.launcher.Launcher.launch (Launcher.java:225)
    at org.codehaus.plexus.classworlds.launcher.Launcher.mainWithExitCode (Launcher.java:406)
    at org.codehaus.plexus.classworlds.launcher.Launcher.main (Launcher.java:347)
Caused by: org.apache.maven.plugins.checkstyle.exec.CheckstyleExecutorException: There is 1 error reported by Checkstyle 8.19 with checkstyle.xml ruleset.
    at org.apache.maven.plugins.checkstyle.exec.DefaultCheckstyleExecutor.executeCheckstyle (DefaultCheckstyleExecutor.java:308)
    at org.apache.maven.plugins.checkstyle.CheckstyleViolationCheckMojo.execute (CheckstyleViolationCheckMojo.java:537)
    at org.apache.maven.plugin.DefaultBuildPluginManager.executeMojo (DefaultBuildPluginManager.java:137)
    at org.apache.maven.lifecycle.internal.MojoExecutor.execute (MojoExecutor.java:210)
    at org.apache.maven.lifecycle.internal.MojoExecutor.execute (MojoExecutor.java:156)
    at org.apache.maven.lifecycle.internal.MojoExecutor.execute (MojoExecutor.java:148)
    at org.apache.maven.lifecycle.internal.LifecycleModuleBuilder.buildProject (LifecycleModuleBuilder.java:117)
    at org.apache.maven.lifecycle.internal.LifecycleModuleBuilder.buildProject (LifecycleModuleBuilder.java:81)
    at org.apache.maven.lifecycle.internal.builder.singlethreaded.SingleThreadedBuilder.build (SingleThreadedBuilder.java:56)
    at org.apache.maven.lifecycle.internal.LifecycleStarter.execute (LifecycleStarter.java:128)
    at org.apache.maven.DefaultMaven.doExecute (DefaultMaven.java:305)
    at org.apache.maven.DefaultMaven.doExecute (DefaultMaven.java:192)
    at org.apache.maven.DefaultMaven.execute (DefaultMaven.java:105)
    at org.apache.maven.cli.MavenCli.execute (MavenCli.java:957)
    at org.apache.maven.cli.MavenCli.doMain (MavenCli.java:289)
    at org.apache.maven.cli.MavenCli.main (MavenCli.java:193)
    at sun.reflect.NativeMethodAccessorImpl.invoke0 (Native Method)
    at sun.reflect.NativeMethodAccessorImpl.invoke (NativeMethodAccessorImpl.java:62)
    at sun.reflect.DelegatingMethodAccessorImpl.invoke (DelegatingMethodAccessorImpl.java:43)
    at java.lang.reflect.Method.invoke (Method.java:498)
    at org.codehaus.plexus.classworlds.launcher.Launcher.launchEnhanced (Launcher.java:282)
    at org.codehaus.plexus.classworlds.launcher.Launcher.launch (Launcher.java:225)
    at org.codehaus.plexus.classworlds.launcher.Launcher.mainWithExitCode (Launcher.java:406)
    at org.codehaus.plexus.classworlds.launcher.Launcher.main (Launcher.java:347)
[ERROR] 
[ERROR] 
[ERROR] For more information about the errors and possible solutions, please read the following articles:
[ERROR] [Help 1] http://cwiki.apache.org/confluence/display/MAVEN/MojoExecutionException
[ERROR] 
[ERROR] After correcting the problems, you can resume the build with the command
[ERROR]   mvn <args> -rf :fe-core

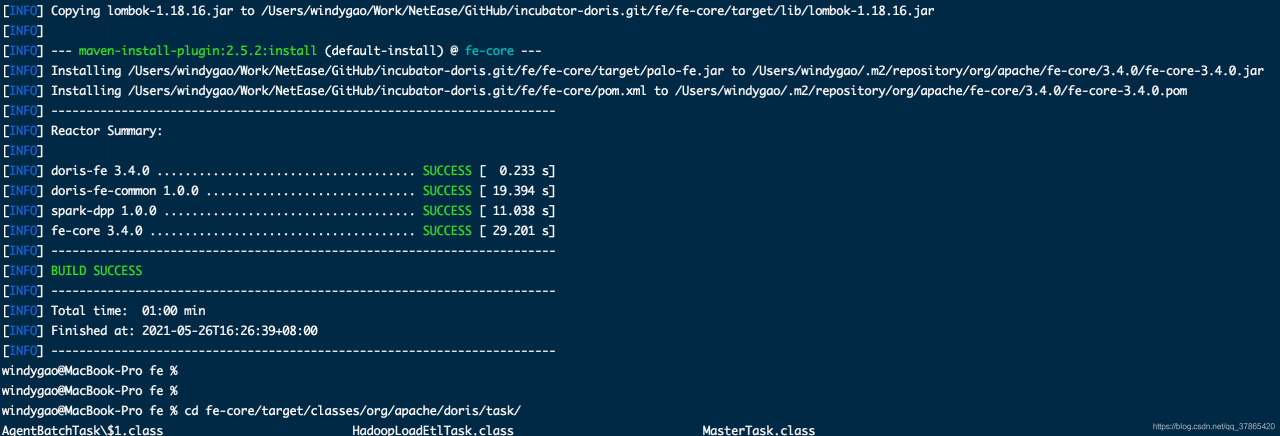
Direct jumping over
-Dcheckstyle.skip
success

Communication link failure when connecting Doris

Springboot queries Doris with an error

ERROR [http-nio-10020-exec-12] [http-nio-10020-exec-12raceId] [] [5] @@GlobalExceptionAdvice@@ | server error 
org.springframework.dao.RecoverableDataAccessException: 
### Error querying database.  Cause: com.mysql.jdbc.exceptions.jdbc4.CommunicationsException: Communications link failure

The last packet successfully received from the server was 426 milliseconds ago.  The last packet sent successfully to the server was 0 milliseconds ago.
; Communications link failure

The last packet successfully received from the server was 426 milliseconds ago.  The last packet sent successfully to the server was 0 milliseconds ago.; nested exception is com.mysql.jdbc.exceptions.jdbc4.CommunicationsException: Communications link failure

The last packet successfully received from the server was 426 milliseconds ago.  The last packet sent successfully to the server was 0 milliseconds ago.

An error is reported in the insert into select task scheduled by Doris

ERROR 2013 (HY000) at line 7: Lost connection to MySQL server during query

analysis

It may be that slow queries cause huge pressure on the cluster.
several slow queries reach 120s-400s, which is unbearable for the Doris cluster because of the global query_ The timeout parameter is 60. It is assumed that the task session variable of someone is set to 600s or higher

Let the development offline slow query task and the tuning SQL
slow query task for more than 100 seconds work normally after offline

But after a while, the springboot service alarms. There are mistakes again

Doris parameter

interactive_timeout=3880000

wait_timeout=3880000

Doris Fe service node alarm log

2021-06-03 16:00:08,398 WARN (Connect-Scheduler-Check-Timer-0|79) [ConnectContext.checkTimeout():365] kill wait timeout connection, remote: 1.1.1.1:57399, wait timeout: 3880000
2021-06-03 16:00:08,398 WARN (Connect-Scheduler-Check-Timer-0|79) [ConnectContext.kill():339] kill timeout query, 1.1.1.1.1:57399, kill connection: true

Doris monitoring

It can be seen that the number of connections at 15:44 drops sharply

#Elk log
you can also see that the alarm and error messages of Doris queried by springboot service also start at 15:44
so what operation variables affect the cluster at 15:44?

See waite according to the error report
_ The time is 3880000s, which is 44 days, but the default in the source code is 28800s

interactive_timeout=3880000

wait_timeout=3880000

No one went online, no one cut, and the Cluster Administrator was in my hands. I didn’t change the parameters, but I’m still not sure why the parameters will change. Go to the fe.audit audit audit log to check the operation records. Sure enough,
someone ( insider ) was using the 2020.2.3 version of DataGrid. At 15:44, the set global parameters were modified

interactive_timeout=3880000

wait_timeout=3880000

call back the two parameters to 28800s , and the connections of the cluster are restored immediately
it should be noted here that in the discussion with the community, there is only wait in Doris_ Timeout works, and the other is interactive_ Timeout in order to be compatible with MySQL, it doesn’t work

Question: why wait in Doris_ When the timeout parameter is too large, it will cause a connection error communications link failure
on the contrary, it can return to normal after being reduced. You need to sort out the code and look at the logic

Please check the
connection Doris error communications link failure