Python — using Matplotlib to draw histogram
1. Basic histogram
First, install Matplotlib( http://matplotlib.org/api/pyplot_ api.html#matplotlib . pyplot.plot )You can use the PIP command to install it directly
# -*- coding: utf-8 -*-
import matplotlib.pyplot as plt

num_list = [1.5,0.6,7.8,6]
plt.bar(range(len(num_list)), num_list)
plt.show()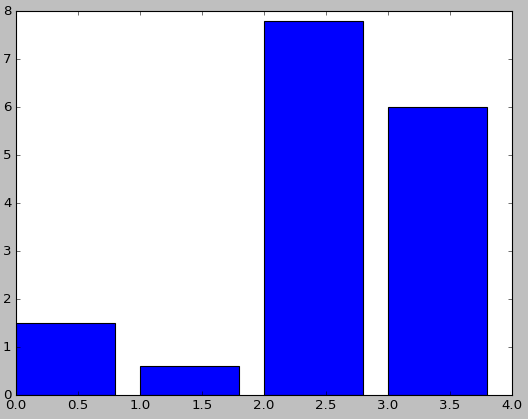
2. Set color
# -*- coding: utf-8 -*-
import matplotlib.pyplot as plt

num_list = [1.5,0.6,7.8,6]
plt.bar(range(len(num_list)), num_list,fc='r')
plt.show()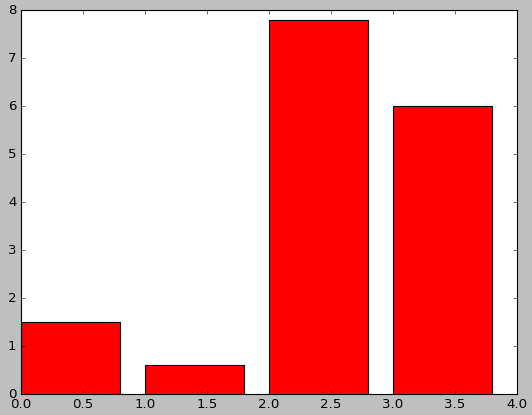
# -*- coding: utf-8 -*-
import matplotlib.pyplot as plt

num_list = [1.5,0.6,7.8,6]
plt.bar(range(len(num_list)), num_list,color='rgb')
plt.show()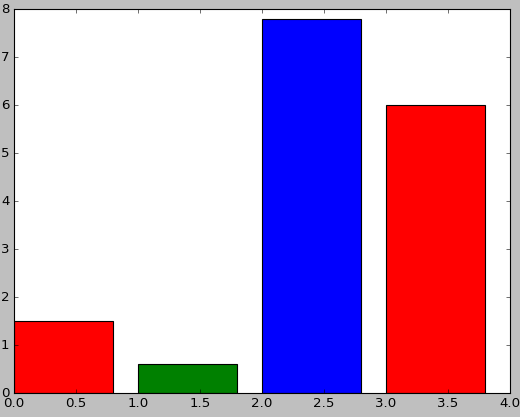
3. Set label
# -*- coding: utf-8 -*-
import matplotlib.pyplot as plt

name_list = ['Monday','Tuesday','Friday','Sunday']
num_list = [1.5,0.6,7.8,6]
plt.bar(range(len(num_list)), num_list,color='rgb',tick_label=name_list)
plt.show()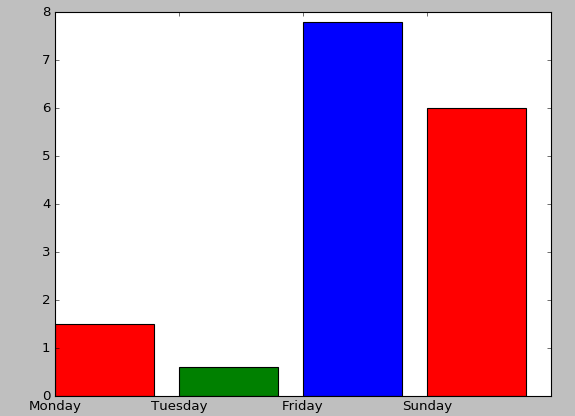
4. Stacked bar chart
# -*- coding: utf-8 -*-
import matplotlib.pyplot as plt

name_list = ['Monday','Tuesday','Friday','Sunday']
num_list = [1.5,0.6,7.8,6]
num_list1 = [1,2,3,1]
plt.bar(range(len(num_list)), num_list, label='boy',fc = 'y')
plt.bar(range(len(num_list)), num_list1, bottom=num_list, label='girl',tick_label = name_list,fc = 'r')
plt.legend()
plt.show()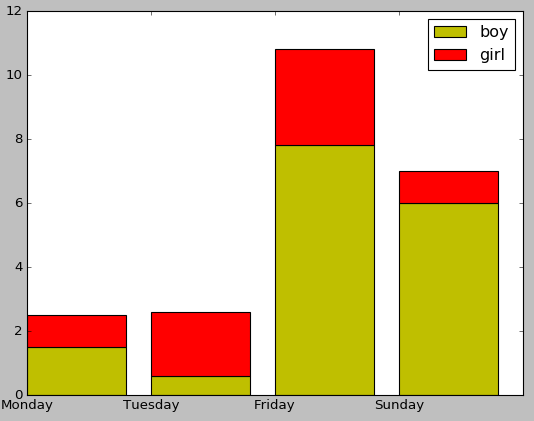
5. Side by side bar chart
# -*- coding: utf-8 -*-
import matplotlib.pyplot as plt

name_list = ['Monday','Tuesday','Friday','Sunday']
num_list = [1.5,0.6,7.8,6]
num_list1 = [1,2,3,1]
x =list(range(len(num_list)))
total_width, n = 0.8, 2
width = total_width / n

plt.bar(x, num_list, width=width, label='boy',fc = 'y')
for i in range(len(x)):
    x[i] = x[i] + width
plt.bar(x, num_list1, width=width, label='girl',tick_label = name_list,fc = 'r')
plt.legend()
plt.show()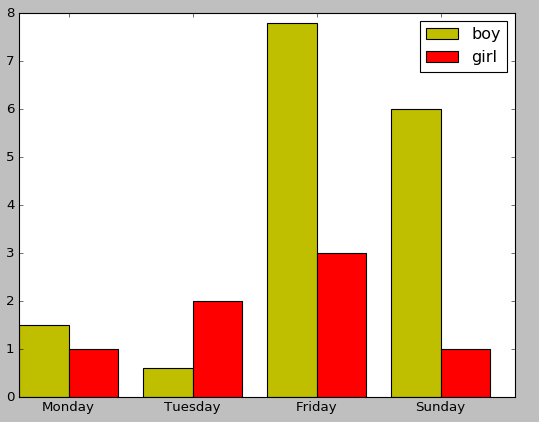
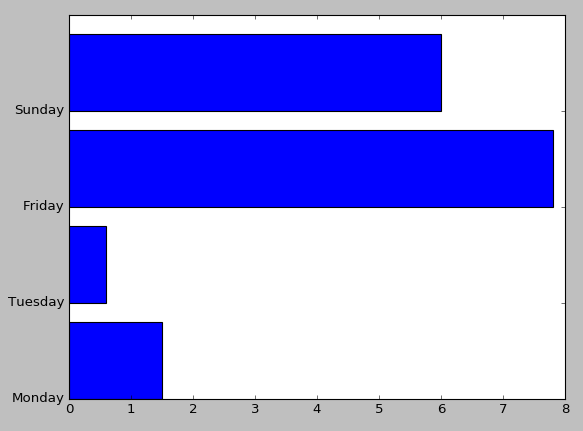
6. Bar chart
# -*- coding: utf-8 -*-
import matplotlib.pyplot as plt

name_list = ['Monday','Tuesday','Friday','Sunday']
num_list = [1.5,0.6,7.8,6]
plt.barh(range(len(num_list)), num_list,tick_label = name_list)
plt.show()