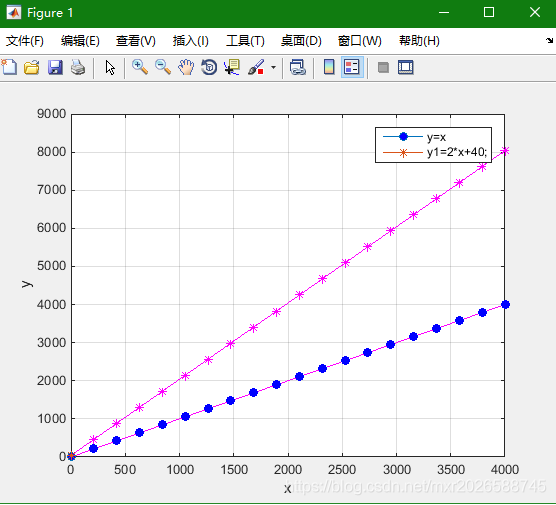
implementation:

when variable points are dense, use the tag to draw the graph, the graph will be very strange.
this method generates a specified number of tags and draws the legend accurately.
The essence of drawing is to draw lines, draw lines first, then generate a specified number of markers, set symbols for drawing markers, and finally draw legend, display legend.
implementation code is as follows :
clear;
clc;

x = 1:1:4000;
y=x;
figure(1);
N=20;
k=round(linspace(1,size(x,2),N));%自变量范围内产生20个数值
plot(x,y,'m-');%实际曲线
grid on;
hold on;
h0=plot(x(k),y(k),'bo','MarkerFaceColor','b');%标记
f1=plot(x(1),y(1),'o-','MarkerFaceColor','b');%图例用图
% legend(f1,'DDIBFO');


hold on;

y1=2*x+40;
plo