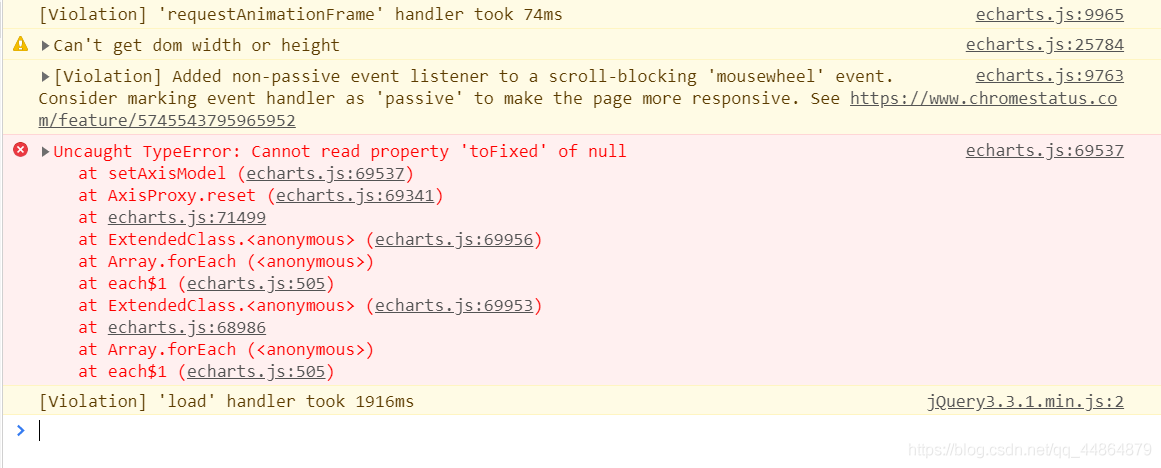
Error chart:

when making the line chart , the data is obtained through Ajax , that is, clicking different values will display different charts, and then such an error occurs in the process of testing<
refer to several blogs:
ecarts.js report error cannot read property ‘ToFixed’ of null
it’s written very carefully, but it’s useless for my questions here ε=(´ο`*))) Alas
In the process of solving the above problems, the console has a warning there is a chart instance already initialized on the DOM (not in the screenshot above), and I want to know the problem to be solved, so I take a look at Baidu:
1, there is a chart instance already initialized on the DOM
2 Ecart notes – initialization and destruction
although this is not helpful for my problems, it makes me understand ecarts a little more. Let’s talk about the problems I have solved!
In fact, it’s very simple, I suddenly have an idea, try the next result is good
at the beginning, there are data (more than two), and graphics can be drawn
when you click other, the graph will not come out (at this time, there is only one data). After thinking about it, the line chart can be drawn from at least two data, ah!
Solution: there may be only one data